Chinde Facts
| Area | 881.3 km² |
| Population | 45,123 |
| Male Population | 21,610 (47.9%) |
| Female Population | 23,513 (52.1%) |
| Population change (1975 to 2020) | -22.5% |
| Population change (2000 to 2020) | -4.5% |
| Median Age | 16.2 years (Male: 15.1, Female: 17.2) |
| Local Time | |
| Timezone | Central Africa Time |
| Lat & Lng | -18.58111, 36.45861 |
Map of Chinde
Interactive Map
Chinde Population
Years 1975 to 2020
| Data | 1975 | 1990 | 2000 | 2015 | 2020 |
|---|---|---|---|---|---|
| Population | 58,250 | 48,292 | 47,268 | 41,144 | 45,123 |
| Population Density | 66.1 / km² | 54.8 / km² | 53.6 / km² | 46.7 / km² | 51.2 / km² |
Chinde Population change from 2000 to 2015
Decrease of 13% from year 2000 to 2015
| Location | Change since 1975 | Change since 1990 | Change since 2000 |
|---|---|---|---|
| Chinde | -29.4% | -14.8% | -13% |
| Zambezia Province | +185.5% | +115.1% | +53.6% |
| Mozambique | +173.4% | +111.3% | +53.8% |
Chinde Median Age
Median Age: 16.2 years
| Location | Median Age | Median Age (Female) | Median Age (Male) |
|---|---|---|---|
| Chinde | 16.2 yrs | 17.2 yrs | 15.1 yrs |
| Zambezia Province | 15.1 yrs | 16 yrs | 14.4 yrs |
| Mozambique | 16.7 yrs | 17.5 yrs | 15.8 yrs |
Chinde Population Density
Population Density: 51.2 / km²
| Location | Population | Area | Density |
|---|---|---|---|
| Chinde | 45,123 | 881.3 km² | 51.2 / km² |
| Zambezia Province | 5.2 million | 103,071.8 km² | 50.1 / km² |
| Mozambique | 27.5 million | 786,431.3 km² | 34.9 / km² |
Chinde Historical and Projected Population
Estimated Population from 200 to 2100
- JRC (European Commission's Joint Research Centre) work on the GHS built-up grid
- CIESIN (Center for International Earth Science Information Network)
- [Link] Klein Goldewijk, K., Beusen, A., Doelman, J., and Stehfest, E.: Anthropogenic land use estimates for the Holocene – HYDE 3.2, Earth Syst. Sci. Data, 9, 927–953, https://doi.org/10.5194/essd-9-927-2017, 2017.
Human Development Index (HDI)
Statistic composite index of life expectancy, education, and per capita income.
Chinde CO2 Emissions
Carbon Dioxide (CO2) Emissions Per Capita in Tonnes Per Year
| Location | CO2 Emissions | CO2 Emissions Per Capita | CO2 Emissions Intensity |
|---|---|---|---|
| Chinde | 8,003 tn | 0.18 tn | 9.1 tons/km² |
| Zambezia Province | 960,099 tn | 0.19 tn | 9.3 tons/km² |
| Mozambique | 5,734,289 tn | 0.21 tn | 7.3 tons/km² |
| 2013 CO2 emissions (tonnes/year) | 8,003 tn |
| 2013 CO2 emissions (tonnes/year) per capita | 0.18 tn |
| 2013 CO2 emissions intensity (tonnes/km²/year) | 9.1 tons/km² |
Natural Hazards Risk
Relative risk out of 10
| Hazard | Risk Level |
|---|---|
| Flood | Medium (4) |
| Cyclone | High (9) |
* Risk, particularly concerning flood or landslide, may not be for the entire area.
- Dilley, M., R.S. Chen, U. Deichmann, A.L. Lerner-Lam, M. Arnold, J. Agwe, P. Buys, O. Kjekstad, B. Lyon, and G. Yetman. 2005. Natural Disaster Hotspots: A Global Risk Analysis. Washington, D.C.: World Bank. https://doi.org/10.1596/0-8213-5930-4.
- Center for Hazards and Risk Research - CHRR - Columbia University, Center for International Earth Science Information Network - CIESIN - Columbia University, International Bank for Reconstruction and Development - The World Bank, and United Nations Environment Programme Global Resource Information Database Geneva - UNEP/GRID-Geneva. 2005. Global Cyclone Hazard Frequency and Distribution. Palisades, NY: NASA Socioeconomic Data and Applications Center (SEDAC). https://doi.org/10.7927/H4CZ353K.
- Center for Hazards and Risk Research - CHRR - Columbia University, Center for International Earth Science Information Network - CIESIN - Columbia University. 2005. Global Flood Hazard Frequency and Distribution. Palisades, NY: NASA Socioeconomic Data and Applications Center (SEDAC). https://doi.org/10.7927/H4668B3D.
Recent Nearby Earthquakes
Magnitude 3.0 and greater
| Date▼ | Time↕ | Magnitude↕ | Distance↕ | Depth↕ | Location↕ | Link |
|---|---|---|---|---|---|---|
| 10/5/81 | 6:11 AM | 5 | 45.3 km | 33,000 m | Mozambique | usgs.gov |
Chinde
Chinde is a town of Mozambique, and a port for the Zambezi valley. It is located on the Chinde River, and is an important fishing center. It exports copra and sugar, and had a population of 16,500 in 1980. Chinde lies in Chinde District of Zambezia P..
Chinde Wikipedia Page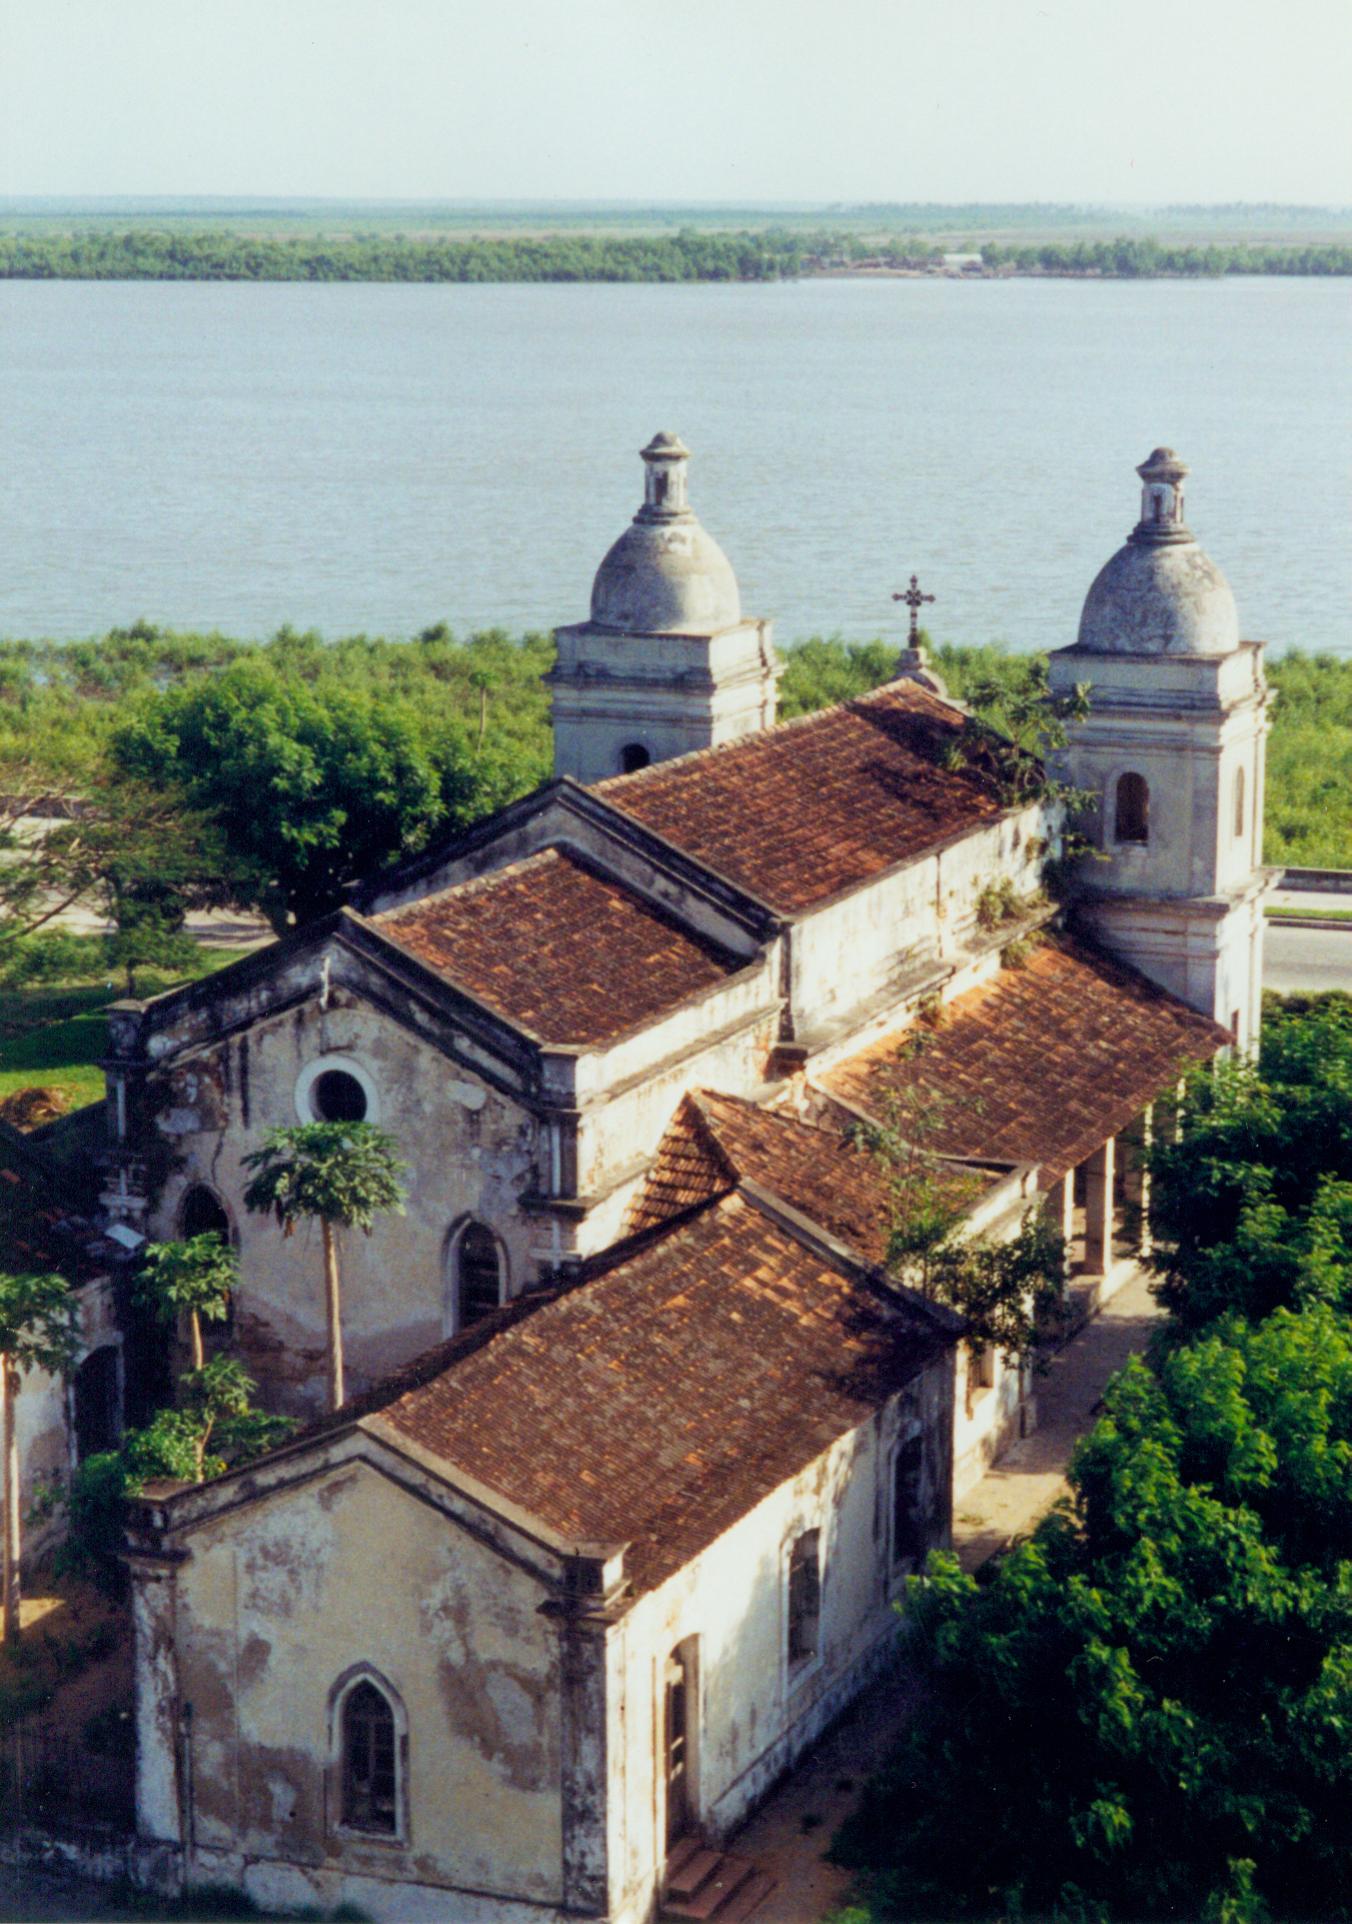
About Our Data
The data on this page is estimated using a number of publicly available tools and resources. It is provided without warranty, and could contain inaccuracies. Use at your own risk.