Uis Facts
| Area | 0.4 km² |
| Population | 187 |
| Male Population | 100 (53.2%) |
| Female Population | 87 (46.8%) |
| Population change (1975 to 2020) | +259.6% |
| Population change (2000 to 2020) | +34.5% |
| Median Age | 22.9 years (Male: 23, Female: 22.6) |
| Area Codes | 64 |
| Local Time | |
| Timezone | Central Africa Time |
| Lat & Lng | -21.21667, 14.85000 |
Map of Uis
Interactive Map
Uis Population
Years 1975 to 2020
| Data | 1975 | 1990 | 2000 | 2015 | 2020 |
|---|---|---|---|---|---|
| Population | 52 | 105 | 139 | 169 | 187 |
| Population Density | 138.7 / km² | 280 / km² | 370.7 / km² | 450.7 / km² | 498.7 / km² |
Uis Population change from 2000 to 2015
Increase of 21.6% from year 2000 to 2015
| Location | Change since 1975 | Change since 1990 | Change since 2000 |
|---|---|---|---|
| Uis | +225% | +61% | +21.6% |
| Erongo Region | +523.4% | +191.6% | +76.7% |
| Namibia | +169.8% | +71.5% | +28.5% |
Uis Median Age
Median Age: 22.9 years
| Location | Median Age | Median Age (Female) | Median Age (Male) |
|---|---|---|---|
| Uis | 22.9 yrs | 22.6 yrs | 23 yrs |
| Erongo Region | 26.5 yrs | 25.7 yrs | 27.2 yrs |
| Namibia | 21.1 yrs | 21.7 yrs | 20.6 yrs |
Uis Population Density
Population Density: 499 / km²
| Location | Population | Area | Density |
|---|---|---|---|
| Uis | 187 | 0.375 km² | 499 / km² |
| Erongo Region | 189,744 | 63,664 km² | 3 / km² |
| Namibia | 2.5 million | 824,094.1 km² | 3 / km² |
Uis Historical and Projected Population
Estimated Population from 1800 to 2100
- JRC (European Commission's Joint Research Centre) work on the GHS built-up grid
- CIESIN (Center for International Earth Science Information Network)
- [Link] Klein Goldewijk, K., Beusen, A., Doelman, J., and Stehfest, E.: Anthropogenic land use estimates for the Holocene – HYDE 3.2, Earth Syst. Sci. Data, 9, 927–953, https://doi.org/10.5194/essd-9-927-2017, 2017.
Human Development Index (HDI)
Statistic composite index of life expectancy, education, and per capita income.
Uis CO2 Emissions
Carbon Dioxide (CO2) Emissions Per Capita in Tonnes Per Year
| Location | CO2 Emissions | CO2 Emissions Per Capita | CO2 Emissions Intensity |
|---|---|---|---|
| Uis | 484 tn | 2.59 tn | 1,289.8 tons/km² |
| Erongo Region | 609,262 tn | 3.21 tn | 9.6 tons/km² |
| Namibia | 7,056,182 tn | 2.84 tn | 8.6 tons/km² |
| 2013 CO2 emissions (tonnes/year) | 484 tn |
| 2013 CO2 emissions (tonnes/year) per capita | 2.59 tn |
| 2013 CO2 emissions intensity (tonnes/km²/year) | 1,289.8 tons/km² |
Recent Nearby Earthquakes
Magnitude 3.0 and greater
| Date▼ | Time↕ | Magnitude↕ | Distance↕ | Depth↕ | Location↕ | Link |
|---|---|---|---|---|---|---|
| 7/31/09 | 8:14 AM | 5.1 | 28.1 km | 10,000 m | Namibia | usgs.gov |
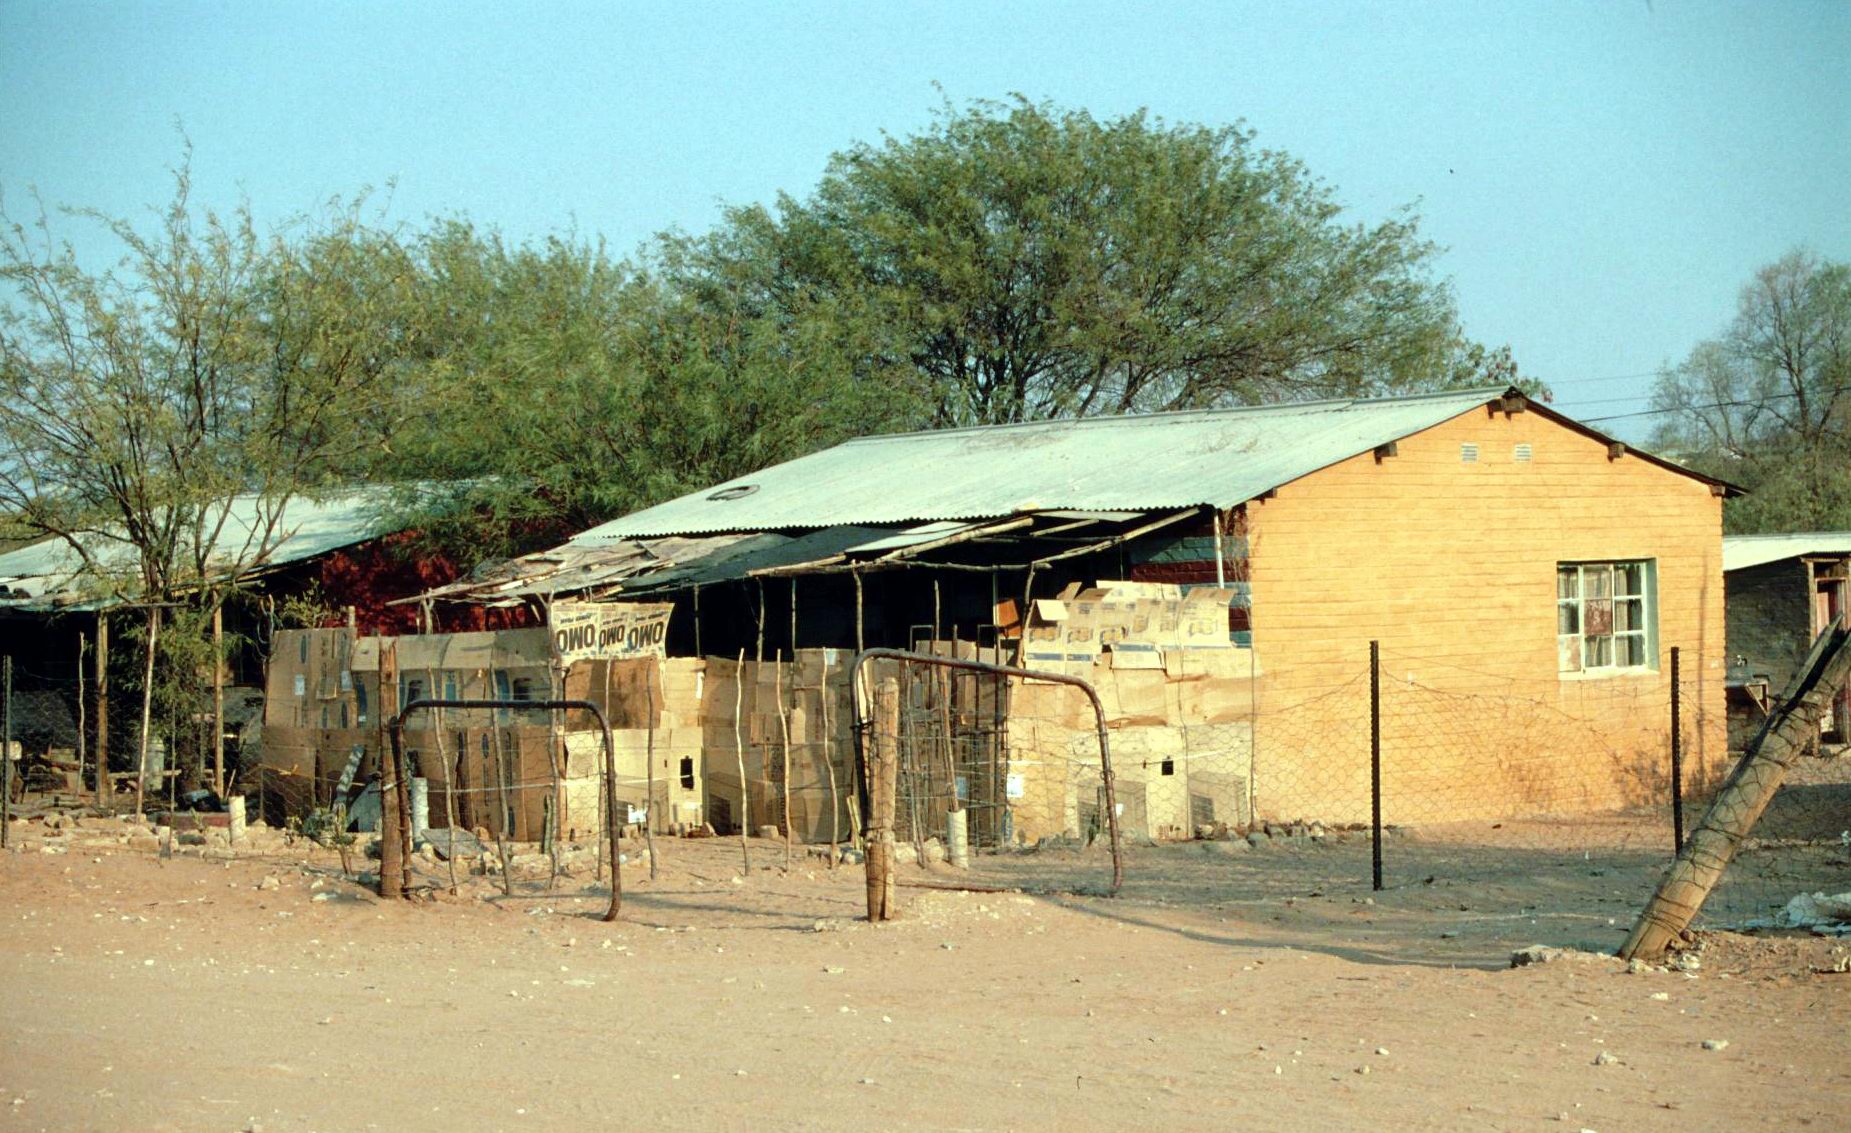
Uis
Uis is a settlement located in Erongo Region, Namibia. It belongs to the Dâures electoral constituency. Located in the former Damaraland, it is known for the local mineral wealth. The settlement has approximately 3,600 inhabitants and, before being d..
Uis Wikipedia Page
About Our Data
The data on this page is estimated using a number of publicly available tools and resources. It is provided without warranty, and could contain inaccuracies. Use at your own risk.