Categories in Dekina
Industries
Business Distribution by Industry in Dekina
| Industry Description | Number of Establishments |
|---|---|
| Hospitals | 37 |
| Shopping other | 16 |
Map of Dekina
Interactive Map
Dekina Population
Years 1975 to 2020
| Data | 1975 | 1990 | 2000 | 2015 | 2020 |
|---|---|---|---|---|---|
| Population | 13,053 | 15,120 | 16,360 | 19,979 | 22,511 |
| Population Density | 12,285.2 / km² | 14,230.6 / km² | 15,397.6 / km² | 18,803.8 / km² | 21,186.8 / km² |
Dekina Population change from 2000 to 2015
Increase of 22.1% from year 2000 to 2015
| Location | Change since 1975 | Change since 1990 | Change since 2000 |
|---|---|---|---|
| Dekina | +53.1% | +32.1% | +22.1% |
| Kogi | +171.5% | +83.7% | +45.1% |
| Nigeria | +186.7% | +90.6% | +48.3% |
Dekina Population Density
Population Density: 21,187 / km²
| Location | Population | Area | Density |
|---|---|---|---|
| Dekina | 22,511 | 1.063 km² | 21,187 / km² |
| Kogi | 4.1 million | 29,048.2 km² | 141 / km² |
| Nigeria | 182 million | 909,042.9 km² | 200 / km² |
Dekina Historical and Projected Population
Estimated Population from 600 to 2100
- JRC (European Commission's Joint Research Centre) work on the GHS built-up grid
- CIESIN (Center for International Earth Science Information Network)
- [Link] Klein Goldewijk, K., Beusen, A., Doelman, J., and Stehfest, E.: Anthropogenic land use estimates for the Holocene – HYDE 3.2, Earth Syst. Sci. Data, 9, 927–953, https://doi.org/10.5194/essd-9-927-2017, 2017.
Human Development Index (HDI)
Statistic composite index of life expectancy, education, and per capita income.
Dekina CO2 Emissions
Carbon Dioxide (CO2) Emissions Per Capita in Tonnes Per Year
| Location | CO2 Emissions | CO2 Emissions Per Capita | CO2 Emissions Intensity |
|---|---|---|---|
| Dekina | 10,624 tn | 0.47 tn | 9,998.7 tons/km² |
| Kogi | 1,953,426 tn | 0.48 tn | 67.2 tons/km² |
| Nigeria | 86,705,254 tn | 0.48 tn | 95.4 tons/km² |
| 2013 CO2 emissions (tonnes/year) | 10,624 tn |
| 2013 CO2 emissions (tonnes/year) per capita | 0.47 tn |
| 2013 CO2 emissions intensity (tonnes/km²/year) | 9,998.7 tons/km² |
Dekina
Dekina is a local government area in Kogi State, Nigeria. Its headquarters are in the town of Dekina on the A233 highway in the north of the area at7°41′41″N 7°01′20″E. northeasterly line of equal latitude and longitude passes through the southeast ..
Dekina Wikipedia Page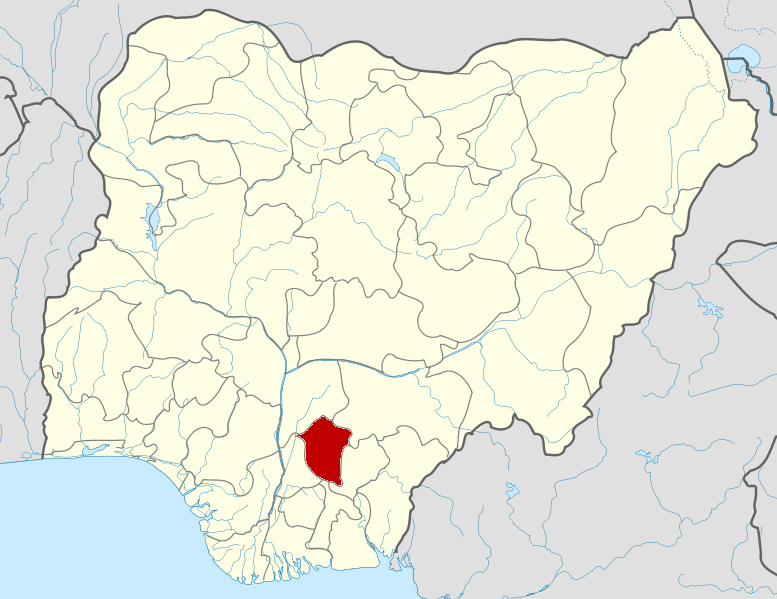


About Our Data
The data on this page is estimated using a number of publicly available tools and resources. It is provided without warranty, and could contain inaccuracies. Use at your own risk.