Emure Facts
| Area | 3.6 km² |
| Population | 95,038 |
| Male Population | 48,159 (50.7%) |
| Female Population | 46,879 (49.3%) |
| Population change (1975 to 2020) | +164.4% |
| Population change (2000 to 2020) | +52.4% |
| Median Age | 21 years (Male: 20.6, Female: 21.3) |
| Local Time | |
| Timezone | West Africa Time |
| Lat & Lng | 7.43636, 5.45925 |
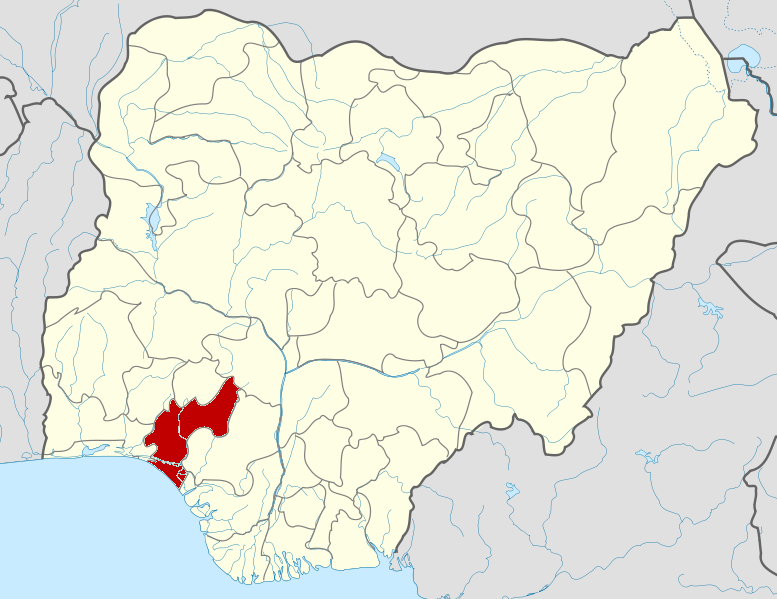
Map of Emure
Interactive Map
Emure Population
Years 1975 to 2020
| Data | 1975 | 1990 | 2000 | 2015 | 2020 |
|---|---|---|---|---|---|
| Population | 35,939 | 51,748 | 62,344 | 85,290 | 95,038 |
| Population Density | 9,914.2 / km² | 14,275.3 / km² | 17,198.3 / km² | 23,528.3 / km² | 26,217.4 / km² |
Emure Population change from 2000 to 2015
Increase of 36.8% from year 2000 to 2015
| Location | Change since 1975 | Change since 1990 | Change since 2000 |
|---|---|---|---|
| Emure | +137.3% | +64.8% | +36.8% |
| Ekiti State | +174.1% | +84.2% | +44.9% |
| Nigeria | +186.7% | +90.6% | +48.3% |
Emure Median Age
Median Age: 21 years
| Location | Median Age | Median Age (Female) | Median Age (Male) |
|---|---|---|---|
| Emure | 21 yrs | 21.3 yrs | 20.6 yrs |
| Ekiti State | 20.3 yrs | 20.8 yrs | 19.7 yrs |
| Nigeria | 18.9 yrs | 19.3 yrs | 18.5 yrs |
Emure Population Density
Population Density: 26,217 / km²
| Location | Population | Area | Density |
|---|---|---|---|
| Emure | 95,038 | 3.625 km² | 26,217 / km² |
| Ekiti State | 3.1 million | 5,782.3 km² | 542 / km² |
| Nigeria | 182 million | 909,042.9 km² | 200 / km² |
Emure Historical and Projected Population
Estimated Population from 1100 to 2100
- JRC (European Commission's Joint Research Centre) work on the GHS built-up grid
- CIESIN (Center for International Earth Science Information Network)
- [Link] Klein Goldewijk, K., Beusen, A., Doelman, J., and Stehfest, E.: Anthropogenic land use estimates for the Holocene – HYDE 3.2, Earth Syst. Sci. Data, 9, 927–953, https://doi.org/10.5194/essd-9-927-2017, 2017.
Human Development Index (HDI)
Statistic composite index of life expectancy, education, and per capita income.
Emure CO2 Emissions
Carbon Dioxide (CO2) Emissions Per Capita in Tonnes Per Year
| Location | CO2 Emissions | CO2 Emissions Per Capita | CO2 Emissions Intensity |
|---|---|---|---|
| Emure | 51,630 tn | 0.54 tn | 14,242.7 tons/km² |
| Ekiti State | 1,647,665 tn | 0.53 tn | 285 tons/km² |
| Nigeria | 86,705,254 tn | 0.48 tn | 95.4 tons/km² |
| 2013 CO2 emissions (tonnes/year) | 51,630 tn |
| 2013 CO2 emissions (tonnes/year) per capita | 0.54 tn |
| 2013 CO2 emissions intensity (tonnes/km²/year) | 14,242.7 tons/km² |
Natural Hazards Risk
Relative risk out of 10
| Hazard | Risk Level |
|---|---|
| Drought | Medium (4) |
* Risk, particularly concerning flood or landslide, may not be for the entire area.
- Dilley, M., R.S. Chen, U. Deichmann, A.L. Lerner-Lam, M. Arnold, J. Agwe, P. Buys, O. Kjekstad, B. Lyon, and G. Yetman. 2005. Natural Disaster Hotspots: A Global Risk Analysis. Washington, D.C.: World Bank. https://doi.org/10.1596/0-8213-5930-4.
- Center for Hazards and Risk Research - CHRR - Columbia University, Center for International Earth Science Information Network - CIESIN - Columbia University, and International Research Institute for Climate and Society - IRI - Columbia University. 2005. Global Drought Hazard Frequency and Distribution. Palisades, NY: NASA Socioeconomic Data and Applications Center (SEDAC). https://doi.org/10.7927/H4VX0DFT.
Emure
Emure is a town in the Ekiti State of Nigeria. It is also called Emure Ekiti. It became much better known after the king of Emure's grandson Adewale Ogunleye made it into the NFL for the Chicago Bears. Ekiti is one of the more prosperous towns in Ek..
Emure Wikipedia Page


About Our Data
The data on this page is estimated using a number of publicly available tools and resources. It is provided without warranty, and could contain inaccuracies. Use at your own risk.