Categories in Magumeri
Industries
Business Distribution by Industry in Magumeri
| Industry Description | Number of Establishments |
|---|---|
| Primary and elementary schools | 5 |
Magumeri Facts
| Area | 0.6 km² |
| Population | 150,276 |
| Population change (1975 to 2020) | +194.7% |
| Population change (2000 to 2020) | +62.1% |
| Local Time | |
| Timezone | West Africa Time |
| Lat & Lng | 12.11451, 12.82620 |
| Postal Codes | 602104 |
Map of Magumeri
Interactive Map
Magumeri Population
Years 1975 to 2020
| Data | 1975 | 1990 | 2000 | 2015 | 2020 |
|---|---|---|---|---|---|
| Population | 50,995 | 77,991 | 92,684 | 133,314 | 150,276 |
| Population Density | 81,592 / km² | 124,785.6 / km² | 148,294.4 / km² | 213,302.4 / km² | 240,441.6 / km² |
Magumeri Population change from 2000 to 2015
Increase of 43.8% from year 2000 to 2015
| Location | Change since 1975 | Change since 1990 | Change since 2000 |
|---|---|---|---|
| Magumeri | +161.4% | +70.9% | +43.8% |
| Borno State | +227% | +105.3% | +55% |
| Nigeria | +186.7% | +90.6% | +48.3% |
Magumeri Population Density
Population Density: 240,442 / km²
| Location | Population | Area | Density |
|---|---|---|---|
| Magumeri | 150,276 | 0.625 km² | 240,442 / km² |
| Borno State | 5.5 million | 72,299.9 km² | 75.6 / km² |
| Nigeria | 182 million | 909,042.9 km² | 200 / km² |
Magumeri Historical and Projected Population
Estimated Population from 1600 to 2100
- JRC (European Commission's Joint Research Centre) work on the GHS built-up grid
- CIESIN (Center for International Earth Science Information Network)
- [Link] Klein Goldewijk, K., Beusen, A., Doelman, J., and Stehfest, E.: Anthropogenic land use estimates for the Holocene – HYDE 3.2, Earth Syst. Sci. Data, 9, 927–953, https://doi.org/10.5194/essd-9-927-2017, 2017.
Human Development Index (HDI)
Statistic composite index of life expectancy, education, and per capita income.
Magumeri CO2 Emissions
Carbon Dioxide (CO2) Emissions Per Capita in Tonnes Per Year
| Location | CO2 Emissions | CO2 Emissions Per Capita | CO2 Emissions Intensity |
|---|---|---|---|
| Magumeri | 60,451 tn | 0.4 tn | 96,721.2 tons/km² |
| Borno State | 2,199,965 tn | 0.4 tn | 30.4 tons/km² |
| Nigeria | 86,705,254 tn | 0.48 tn | 95.4 tons/km² |
| 2013 CO2 emissions (tonnes/year) | 60,451 tn |
| 2013 CO2 emissions (tonnes/year) per capita | 0.4 tn |
| 2013 CO2 emissions intensity (tonnes/km²/year) | 96,721.2 tons/km² |
Natural Hazards Risk
Relative risk out of 10
| Hazard | Risk Level |
|---|---|
| Drought | Low (2) |
* Risk, particularly concerning flood or landslide, may not be for the entire area.
- Dilley, M., R.S. Chen, U. Deichmann, A.L. Lerner-Lam, M. Arnold, J. Agwe, P. Buys, O. Kjekstad, B. Lyon, and G. Yetman. 2005. Natural Disaster Hotspots: A Global Risk Analysis. Washington, D.C.: World Bank. https://doi.org/10.1596/0-8213-5930-4.
- Center for Hazards and Risk Research - CHRR - Columbia University, Center for International Earth Science Information Network - CIESIN - Columbia University, and International Research Institute for Climate and Society - IRI - Columbia University. 2005. Global Drought Hazard Frequency and Distribution. Palisades, NY: NASA Socioeconomic Data and Applications Center (SEDAC). https://doi.org/10.7927/H4VX0DFT.
Magumeri
Magumeri is a Local Government Area of Borno State, Nigeria. Its headquarters are in the town of Magumeri. has an area of 4,856 km² and a population of 140,231 at the 2006 census. postal code of the area is 602. is one of the sixteen LGAs that con..
Magumeri Wikipedia Page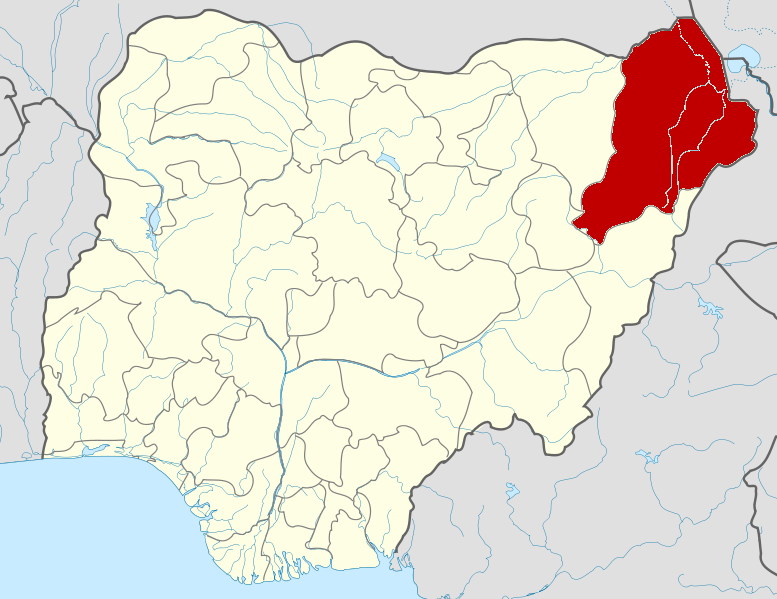
About Our Data
The data on this page is estimated using a number of publicly available tools and resources. It is provided without warranty, and could contain inaccuracies. Use at your own risk.