Odigbo Facts
| Area | 0.9 km² |
| Population | 6,159 |
| Male Population | 3,084 (50.1%) |
| Female Population | 3,075 (49.9%) |
| Population change (1975 to 2020) | +524.0% |
| Population change (2000 to 2020) | +39.4% |
| Median Age | 19.8 years (Male: 19.2, Female: 20.4) |
| Local Time | |
| Timezone | West Africa Time |
| Lat & Lng | 6.78922, 4.86640 |
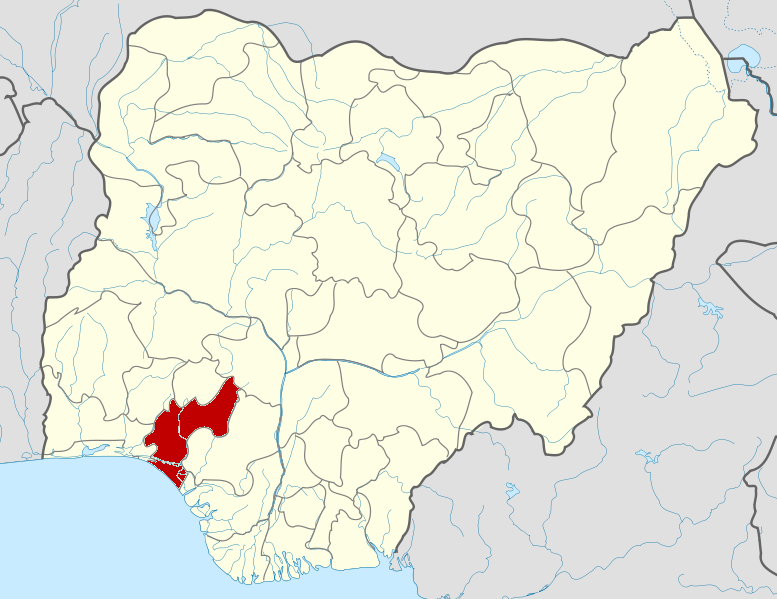
Map of Odigbo
Interactive Map
Odigbo Population
Years 1975 to 2020
| Data | 1975 | 1990 | 2000 | 2015 | 2020 |
|---|---|---|---|---|---|
| Population | 987 | 4,220 | 4,419 | 5,466 | 6,159 |
| Population Density | 1,052.8 / km² | 4,501.3 / km² | 4,713.6 / km² | 5,830.4 / km² | 6,569.6 / km² |
Odigbo Population change from 2000 to 2015
Increase of 23.7% from year 2000 to 2015
| Location | Change since 1975 | Change since 1990 | Change since 2000 |
|---|---|---|---|
| Odigbo | +453.8% | +29.5% | +23.7% |
| Ondo State | +174.1% | +83.6% | +44.5% |
| Nigeria | +186.7% | +90.6% | +48.3% |
Odigbo Median Age
Median Age: 19.8 years
| Location | Median Age | Median Age (Female) | Median Age (Male) |
|---|---|---|---|
| Odigbo | 19.8 yrs | 20.4 yrs | 19.2 yrs |
| Ondo State | 20.3 yrs | 21 yrs | 19.7 yrs |
| Nigeria | 18.9 yrs | 19.3 yrs | 18.5 yrs |
Odigbo Population Density
Population Density: 6,570 / km²
| Location | Population | Area | Density |
|---|---|---|---|
| Odigbo | 6,159 | 0.938 km² | 6,570 / km² |
| Ondo State | 4.5 million | 14,997.7 km² | 300 / km² |
| Nigeria | 182 million | 909,042.9 km² | 200 / km² |
Odigbo Historical and Projected Population
Estimated Population from 1600 to 2100
- JRC (European Commission's Joint Research Centre) work on the GHS built-up grid
- CIESIN (Center for International Earth Science Information Network)
- [Link] Klein Goldewijk, K., Beusen, A., Doelman, J., and Stehfest, E.: Anthropogenic land use estimates for the Holocene – HYDE 3.2, Earth Syst. Sci. Data, 9, 927–953, https://doi.org/10.5194/essd-9-927-2017, 2017.
Human Development Index (HDI)
Statistic composite index of life expectancy, education, and per capita income.
Odigbo CO2 Emissions
Carbon Dioxide (CO2) Emissions Per Capita in Tonnes Per Year
| Location | CO2 Emissions | CO2 Emissions Per Capita | CO2 Emissions Intensity |
|---|---|---|---|
| Odigbo | 3,825 tn | 0.62 tn | 4,079.7 tons/km² |
| Ondo State | 2,563,415 tn | 0.57 tn | 170.9 tons/km² |
| Nigeria | 86,705,254 tn | 0.48 tn | 95.4 tons/km² |
| 2013 CO2 emissions (tonnes/year) | 3,825 tn |
| 2013 CO2 emissions (tonnes/year) per capita | 0.62 tn |
| 2013 CO2 emissions intensity (tonnes/km²/year) | 4,079.7 tons/km² |
Natural Hazards Risk
Relative risk out of 10
| Hazard | Risk Level |
|---|---|
| Drought | Medium (7) |
* Risk, particularly concerning flood or landslide, may not be for the entire area.
- Dilley, M., R.S. Chen, U. Deichmann, A.L. Lerner-Lam, M. Arnold, J. Agwe, P. Buys, O. Kjekstad, B. Lyon, and G. Yetman. 2005. Natural Disaster Hotspots: A Global Risk Analysis. Washington, D.C.: World Bank. https://doi.org/10.1596/0-8213-5930-4.
- Center for Hazards and Risk Research - CHRR - Columbia University, Center for International Earth Science Information Network - CIESIN - Columbia University, and International Research Institute for Climate and Society - IRI - Columbia University. 2005. Global Drought Hazard Frequency and Distribution. Palisades, NY: NASA Socioeconomic Data and Applications Center (SEDAC). https://doi.org/10.7927/H4VX0DFT.
Recent Nearby Earthquakes
Magnitude 3.0 and greater
| Date▼ | Time↕ | Magnitude↕ | Distance↕ | Depth↕ | Location↕ | Link |
|---|---|---|---|---|---|---|
| 3/7/00 | 3:53 PM | 4.5 | 69.8 km | 10,000 m | Nigeria | usgs.gov |
Odigbo
Odigbo is a Local Government Area in Ondo State, Nigeria. Its headquarters are in the town of Ore. has an area of 1,818 km² and a population of 230,351 at the 2006 census. postal code of the area is 350.
Odigbo Wikipedia Page

About Our Data
The data on this page is estimated using a number of publicly available tools and resources. It is provided without warranty, and could contain inaccuracies. Use at your own risk.