Categories in Ogoja
Industries
Business Distribution by Industry in Ogoja
Ogoja Facts
| Area | 1.3 km² |
| Population | 62,657 |
| Male Population | 31,699 (50.6%) |
| Female Population | 30,958 (49.4%) |
| Population change (1975 to 2020) | +1052.2% |
| Population change (2000 to 2020) | +21.0% |
| Median Age | 19.7 years (Male: 19.2, Female: 20.4) |
| Area Codes | 45 |
| Local Time | |
| Timezone | West Africa Time |
| Lat & Lng | 6.65840, 8.79923 |
Map of Ogoja
Interactive Map
Ogoja Population
Years 1975 to 2020
| Data | 1975 | 1990 | 2000 | 2015 | 2020 |
|---|---|---|---|---|---|
| Population | 5,438 | 47,394 | 51,800 | 55,608 | 62,657 |
| Population Density | 4,143.2 / km² | 36,109.7 / km² | 39,466.7 / km² | 42,368 / km² | 47,738.7 / km² |
Ogoja Population change from 2000 to 2015
Increase of 7.4% from year 2000 to 2015
| Location | Change since 1975 | Change since 1990 | Change since 2000 |
|---|---|---|---|
| Ogoja | +922.6% | +17.3% | +7.4% |
| Cross River (state) | +163.8% | +83.5% | +44.7% |
| Nigeria | +186.7% | +90.6% | +48.3% |
Ogoja Median Age
Median Age: 19.7 years
| Location | Median Age | Median Age (Female) | Median Age (Male) |
|---|---|---|---|
| Ogoja | 19.7 yrs | 20.4 yrs | 19.2 yrs |
| Cross River (state) | 20.1 yrs | 20.5 yrs | 19.8 yrs |
| Nigeria | 18.9 yrs | 19.3 yrs | 18.5 yrs |
Ogoja Population Density
Population Density: 47,739 / km²
| Location | Population | Area | Density |
|---|---|---|---|
| Ogoja | 62,657 | 1.313 km² | 47,739 / km² |
| Cross River (state) | 3.4 million | 21,444.8 km² | 159 / km² |
| Nigeria | 182 million | 909,042.9 km² | 200 / km² |
Ogoja Historical and Projected Population
Estimated Population from 1740 to 2100
- JRC (European Commission's Joint Research Centre) work on the GHS built-up grid
- CIESIN (Center for International Earth Science Information Network)
- [Link] Klein Goldewijk, K., Beusen, A., Doelman, J., and Stehfest, E.: Anthropogenic land use estimates for the Holocene – HYDE 3.2, Earth Syst. Sci. Data, 9, 927–953, https://doi.org/10.5194/essd-9-927-2017, 2017.
Area Codes
Percentage Area Codes used by businesses in Ogoja
Human Development Index (HDI)
Statistic composite index of life expectancy, education, and per capita income.
Ogoja CO2 Emissions
Carbon Dioxide (CO2) Emissions Per Capita in Tonnes Per Year
| Location | CO2 Emissions | CO2 Emissions Per Capita | CO2 Emissions Intensity |
|---|---|---|---|
| Ogoja | 32,566 tn | 0.52 tn | 24,811.9 tons/km² |
| Cross River (state) | 1,750,157 tn | 0.51 tn | 81.6 tons/km² |
| Nigeria | 86,705,254 tn | 0.48 tn | 95.4 tons/km² |
| 2013 CO2 emissions (tonnes/year) | 32,566 tn |
| 2013 CO2 emissions (tonnes/year) per capita | 0.52 tn |
| 2013 CO2 emissions intensity (tonnes/km²/year) | 24,811.9 tons/km² |
Ogoja
Ogoja is a Local Government Area in Cross River State, Nigeria. Its headquarters is Ogoja town in the northeast of the area near the A4 highway at6°39′17″N 8°47′51″E. has an area of 972 km² and a population of 171,901 at the 2006 census. postal cod..
Ogoja Wikipedia Page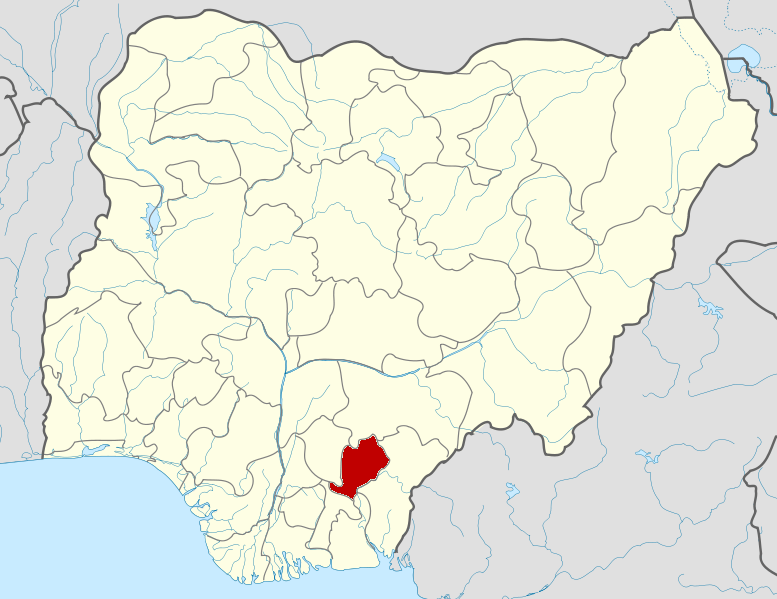
About Our Data
The data on this page is estimated using a number of publicly available tools and resources. It is provided without warranty, and could contain inaccuracies. Use at your own risk.