Categories in Pankshin
Gas StationFuel supplierAnglican ChurchAssemblies of God ChurchCatholic ChurchChurchesChurch of ChristPentecostal ChurchPolitical PartyComputer ServiceElectronics StoreEducationPrimary SchoolPhotographerBar & GrillRestaurantsHospitalsMedical CenterMedical clinicBarbersBusiness CenterGeneral StorePharmacyShopping MallPlaygroundGuest HouseHotels and motels
Industries
Business Distribution by Industry in Pankshin
| Industry Description | Number of Establishments |
|---|---|
| Education | 91 |
| Churches | 79 |
| Hotels and motels | 77 |
| Primary and elementary schools | 41 |
| Shopping other | 31 |
| Hospitals | 25 |
| Other accommodation | 19 |
| Gas station | 15 |
| Restaurants | 13 |
| Shopping | 10 |
Pankshin Facts
| Area | 2.1 km² |
| Population | 41,098 |
| Male Population | 20,298 (49.4%) |
| Female Population | 20,800 (50.6%) |
| Population change (1975 to 2020) | +218.1% |
| Population change (2000 to 2020) | +50.6% |
| Median Age | 17.3 years (Male: 16.6, Female: 18.1) |
| Area Codes | 70 |
| Local Time | |
| Timezone | West Africa Time |
| Lat & Lng | 9.32541, 9.43520 |
| Postal Codes | 933101, 933102, 933103, 933104, 933105, More |
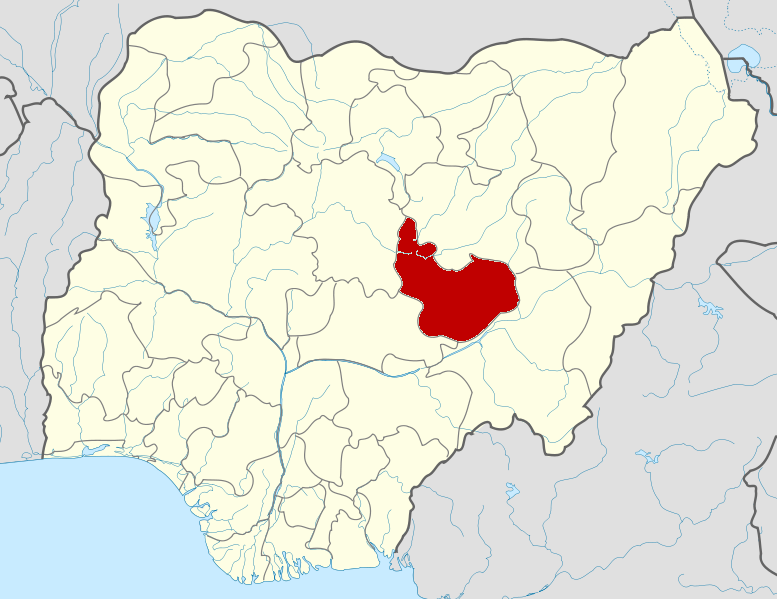
Map of Pankshin
Interactive Map
Pankshin Population
Years 1975 to 2020
| Data | 1975 | 1990 | 2000 | 2015 | 2020 |
|---|---|---|---|---|---|
| Population | 12,921 | 24,862 | 27,296 | 36,548 | 41,098 |
| Population Density | 6,080.5 / km² | 11,699.8 / km² | 12,845.2 / km² | 17,199.1 / km² | 19,340.2 / km² |
Sources: JRC (European Commission's Joint Research Centre) work on the GHS built-up grid
Pankshin Population change from 2000 to 2015
Increase of 33.9% from year 2000 to 2015
| Location | Change since 1975 | Change since 1990 | Change since 2000 |
|---|---|---|---|
| Pankshin | +182.9% | +47% | +33.9% |
| Plateau (state) | +162.7% | +79.2% | +42.6% |
| Nigeria | +186.7% | +90.6% | +48.3% |
Sources: JRC (European Commission's Joint Research Centre) work on the GHS built-up grid
Pankshin Median Age
Median Age: 17.3 years
| Location | Median Age | Median Age (Female) | Median Age (Male) |
|---|---|---|---|
| Pankshin | 17.3 yrs | 18.1 yrs | 16.6 yrs |
| Plateau (state) | 17.8 yrs | 18 yrs | 17.6 yrs |
| Nigeria | 18.9 yrs | 19.3 yrs | 18.5 yrs |
Sources: CIESIN (Center for International Earth Science Information Network)
Pankshin Population Density
Population Density: 19,340 / km²
| Location | Population | Area | Density |
|---|---|---|---|
| Pankshin | 41,098 | 2.125 km² | 19,340 / km² |
| Plateau (state) | 4 million | 26,519.1 km² | 152 / km² |
| Nigeria | 182 million | 909,042.9 km² | 200 / km² |
Sources: JRC (European Commission's Joint Research Centre) work on the GHS built-up grid
Pankshin Historical and Projected Population
Estimated Population from 1600 to 2100
Sources:
- JRC (European Commission's Joint Research Centre) work on the GHS built-up grid
- CIESIN (Center for International Earth Science Information Network)
- [Link] Klein Goldewijk, K., Beusen, A., Doelman, J., and Stehfest, E.: Anthropogenic land use estimates for the Holocene – HYDE 3.2, Earth Syst. Sci. Data, 9, 927–953, https://doi.org/10.5194/essd-9-927-2017, 2017.
Human Development Index (HDI)
Statistic composite index of life expectancy, education, and per capita income.
Source: [Link] Kummu, M., Taka, M. &Guillaume, J. Gridded global datasets for Gross Domestic Product and Human Development Index over 1990–2015. Sci Data 5, 180004 (2018) doi:10.1038/sdata.2018.4
Pankshin CO2 Emissions
Carbon Dioxide (CO2) Emissions Per Capita in Tonnes Per Year
| Location | CO2 Emissions | CO2 Emissions Per Capita | CO2 Emissions Intensity |
|---|---|---|---|
| Pankshin | 20,703 tn | 0.5 tn | 9,742.5 tons/km² |
| Plateau (state) | 1,930,443 tn | 0.48 tn | 72.8 tons/km² |
| Nigeria | 86,705,254 tn | 0.48 tn | 95.4 tons/km² |
Sources: [Link] Moran, D., Kanemoto K; Jiborn, M., Wood, R., Többen, J., and Seto, K.C. (2018) Carbon footprints of 13,000 cities. Environmental Research Letters DOI: 10.1088/1748-9326/aac72a
Pankshin CO2 Emissions
| 2013 CO2 emissions (tonnes/year) | 20,703 tn |
| 2013 CO2 emissions (tonnes/year) per capita | 0.5 tn |
| 2013 CO2 emissions intensity (tonnes/km²/year) | 9,742.5 tons/km² |
Natural Hazards Risk
Relative risk out of 10
| Hazard | Risk Level |
|---|---|
| Drought | Low (2) |
* Risk, particularly concerning flood or landslide, may not be for the entire area.
Sources:
- Dilley, M., R.S. Chen, U. Deichmann, A.L. Lerner-Lam, M. Arnold, J. Agwe, P. Buys, O. Kjekstad, B. Lyon, and G. Yetman. 2005. Natural Disaster Hotspots: A Global Risk Analysis. Washington, D.C.: World Bank. https://doi.org/10.1596/0-8213-5930-4.
- Center for Hazards and Risk Research - CHRR - Columbia University, Center for International Earth Science Information Network - CIESIN - Columbia University, and International Research Institute for Climate and Society - IRI - Columbia University. 2005. Global Drought Hazard Frequency and Distribution. Palisades, NY: NASA Socioeconomic Data and Applications Center (SEDAC). https://doi.org/10.7927/H4VX0DFT.

About Our Data
The data on this page is estimated using a number of publicly available tools and resources. It is provided without warranty, and could contain inaccuracies. Use at your own risk.