Morrito Facts
| Area | 1522.1 km² |
| Population | 7,271 |
| Male Population | 3,744 (51.5%) |
| Female Population | 3,527 (48.5%) |
| Population change (1975 to 2020) | +83.2% |
| Population change (2000 to 2020) | +7.9% |
| Median Age | 18.4 years (Male: 18.7, Female: 18) |
| Local Time | |
| Timezone | Central Standard Time |
| Lat & Lng | 11.62118, -85.08052 |
Map of Morrito
Interactive Map
Morrito Population
Years 1975 to 2020
| Data | 1975 | 1990 | 2000 | 2015 | 2020 |
|---|---|---|---|---|---|
| Population | 3,968 | 6,023 | 6,736 | 6,946 | 7,271 |
| Population Density | 2.6 / km² | 4 / km² | 4.4 / km² | 4.6 / km² | 4.8 / km² |
Morrito Population change from 2000 to 2015
Increase of 3.1% from year 2000 to 2015
| Location | Change since 1975 | Change since 1990 | Change since 2000 |
|---|---|---|---|
| Morrito | +75.1% | +15.3% | +3.1% |
| Río San Juan Department | +281.6% | +106.2% | +53.5% |
| Nicaragua | +117.4% | +46.7% | +21% |
Morrito Median Age
Median Age: 18.4 years
| Location | Median Age | Median Age (Female) | Median Age (Male) |
|---|---|---|---|
| Morrito | 18.4 yrs | 18 yrs | 18.7 yrs |
| Río San Juan Department | 17.5 yrs | 17.4 yrs | 17.5 yrs |
| Nicaragua | 20.4 yrs | 21.2 yrs | 19.7 yrs |
Morrito Population Density
Population Density: 4.8 / km²
| Location | Population | Area | Density |
|---|---|---|---|
| Morrito | 7,271 | 1,522.1 km² | 4.8 / km² |
| Río San Juan Department | 129,039 | 7,629.5 km² | 16.9 / km² |
| Nicaragua | 6.1 million | 128,508.4 km² | 47.1 / km² |
Morrito Historical and Projected Population
Estimated Population from 0 to 2100
- JRC (European Commission's Joint Research Centre) work on the GHS built-up grid
- CIESIN (Center for International Earth Science Information Network)
- [Link] Klein Goldewijk, K., Beusen, A., Doelman, J., and Stehfest, E.: Anthropogenic land use estimates for the Holocene – HYDE 3.2, Earth Syst. Sci. Data, 9, 927–953, https://doi.org/10.5194/essd-9-927-2017, 2017.
Human Development Index (HDI)
Statistic composite index of life expectancy, education, and per capita income.
Morrito CO2 Emissions
Carbon Dioxide (CO2) Emissions Per Capita in Tonnes Per Year
| Location | CO2 Emissions | CO2 Emissions Per Capita | CO2 Emissions Intensity |
|---|---|---|---|
| Morrito | 6,701 tn | 0.92 tn | 4.4 tons/km² |
| Río San Juan Department | 114,890 tn | 0.89 tn | 15.1 tons/km² |
| Nicaragua | 5,658,022 tn | 0.93 tn | 44 tons/km² |
| 2013 CO2 emissions (tonnes/year) | 6,701 tn |
| 2013 CO2 emissions (tonnes/year) per capita | 0.92 tn |
| 2013 CO2 emissions intensity (tonnes/km²/year) | 4.4 tons/km² |
Natural Hazards Risk
Relative risk out of 10
| Hazard | Risk Level |
|---|---|
| Drought | Medium (3.3) |
| Flood | High (9) |
| Earthquake | High (7.3) |
* Risk, particularly concerning flood or landslide, may not be for the entire area.
- Dilley, M., R.S. Chen, U. Deichmann, A.L. Lerner-Lam, M. Arnold, J. Agwe, P. Buys, O. Kjekstad, B. Lyon, and G. Yetman. 2005. Natural Disaster Hotspots: A Global Risk Analysis. Washington, D.C.: World Bank. https://doi.org/10.1596/0-8213-5930-4.
- Center for Hazards and Risk Research - CHRR - Columbia University, Center for International Earth Science Information Network - CIESIN - Columbia University, and International Research Institute for Climate and Society - IRI - Columbia University. 2005. Global Drought Hazard Frequency and Distribution. Palisades, NY: NASA Socioeconomic Data and Applications Center (SEDAC). https://doi.org/10.7927/H4VX0DFT.
- Center for Hazards and Risk Research - CHRR - Columbia University, Center for International Earth Science Information Network - CIESIN - Columbia University. 2005. Global Flood Hazard Frequency and Distribution. Palisades, NY: NASA Socioeconomic Data and Applications Center (SEDAC). https://doi.org/10.7927/H4668B3D.
- Center for Hazards and Risk Research - CHRR - Columbia University, Center for International Earth Science Information Network - CIESIN - Columbia University. 2005. Global Earthquake Hazard Distribution - Peak Ground Acceleration. Palisades, NY: NASA Socioeconomic Data and Applications Center (SEDAC). https://doi.org/10.7927/H4BZ63ZS.
Recent Nearby Earthquakes
Magnitude 3.0 and greater
| Date▼ | Time↕ | Magnitude↕ | Distance↕ | Depth↕ | Location↕ | Link |
|---|---|---|---|---|---|---|
| 8/19/19 | 9:25 PM | 4.4 | 71.9 km | 195,120 m | 5km WNW of San Jose, Costa Rica | usgs.gov |
| 7/3/19 | 10:20 PM | 4.3 | 70.4 km | 199,880 m | 6km S of Moyogalpa, Nicaragua | usgs.gov |
| 4/3/19 | 1:55 PM | 4.6 | 61.3 km | 190,840 m | 14km NNW of Cardenas, Nicaragua | usgs.gov |
| 1/31/19 | 3:13 AM | 4.4 | 52.5 km | 171,410 m | 18km SSE of Altagracia, Nicaragua | usgs.gov |
| 1/18/19 | 12:07 AM | 4.2 | 72.4 km | 175,870 m | 14km WNW of Cardenas, Nicaragua | usgs.gov |
| 6/8/18 | 10:36 PM | 4.5 | 58.5 km | 187,180 m | 10km N of Cardenas, Nicaragua | usgs.gov |
| 5/26/16 | 1:02 AM | 5.2 | 71.5 km | 196,730 m | 5km SSW of Moyogalpa, Nicaragua | usgs.gov |
| 1/14/16 | 5:15 AM | 4.8 | 65.8 km | 190,170 m | 18km SSE of Moyogalpa, Nicaragua | usgs.gov |
| 7/6/15 | 2:17 PM | 4.7 | 71.8 km | 160,690 m | 17km NW of Cardenas, Nicaragua | usgs.gov |
| 10/7/14 | 4:28 AM | 5.1 | 71 km | 190,840 m | 4km SSW of Moyogalpa, Nicaragua | usgs.gov |
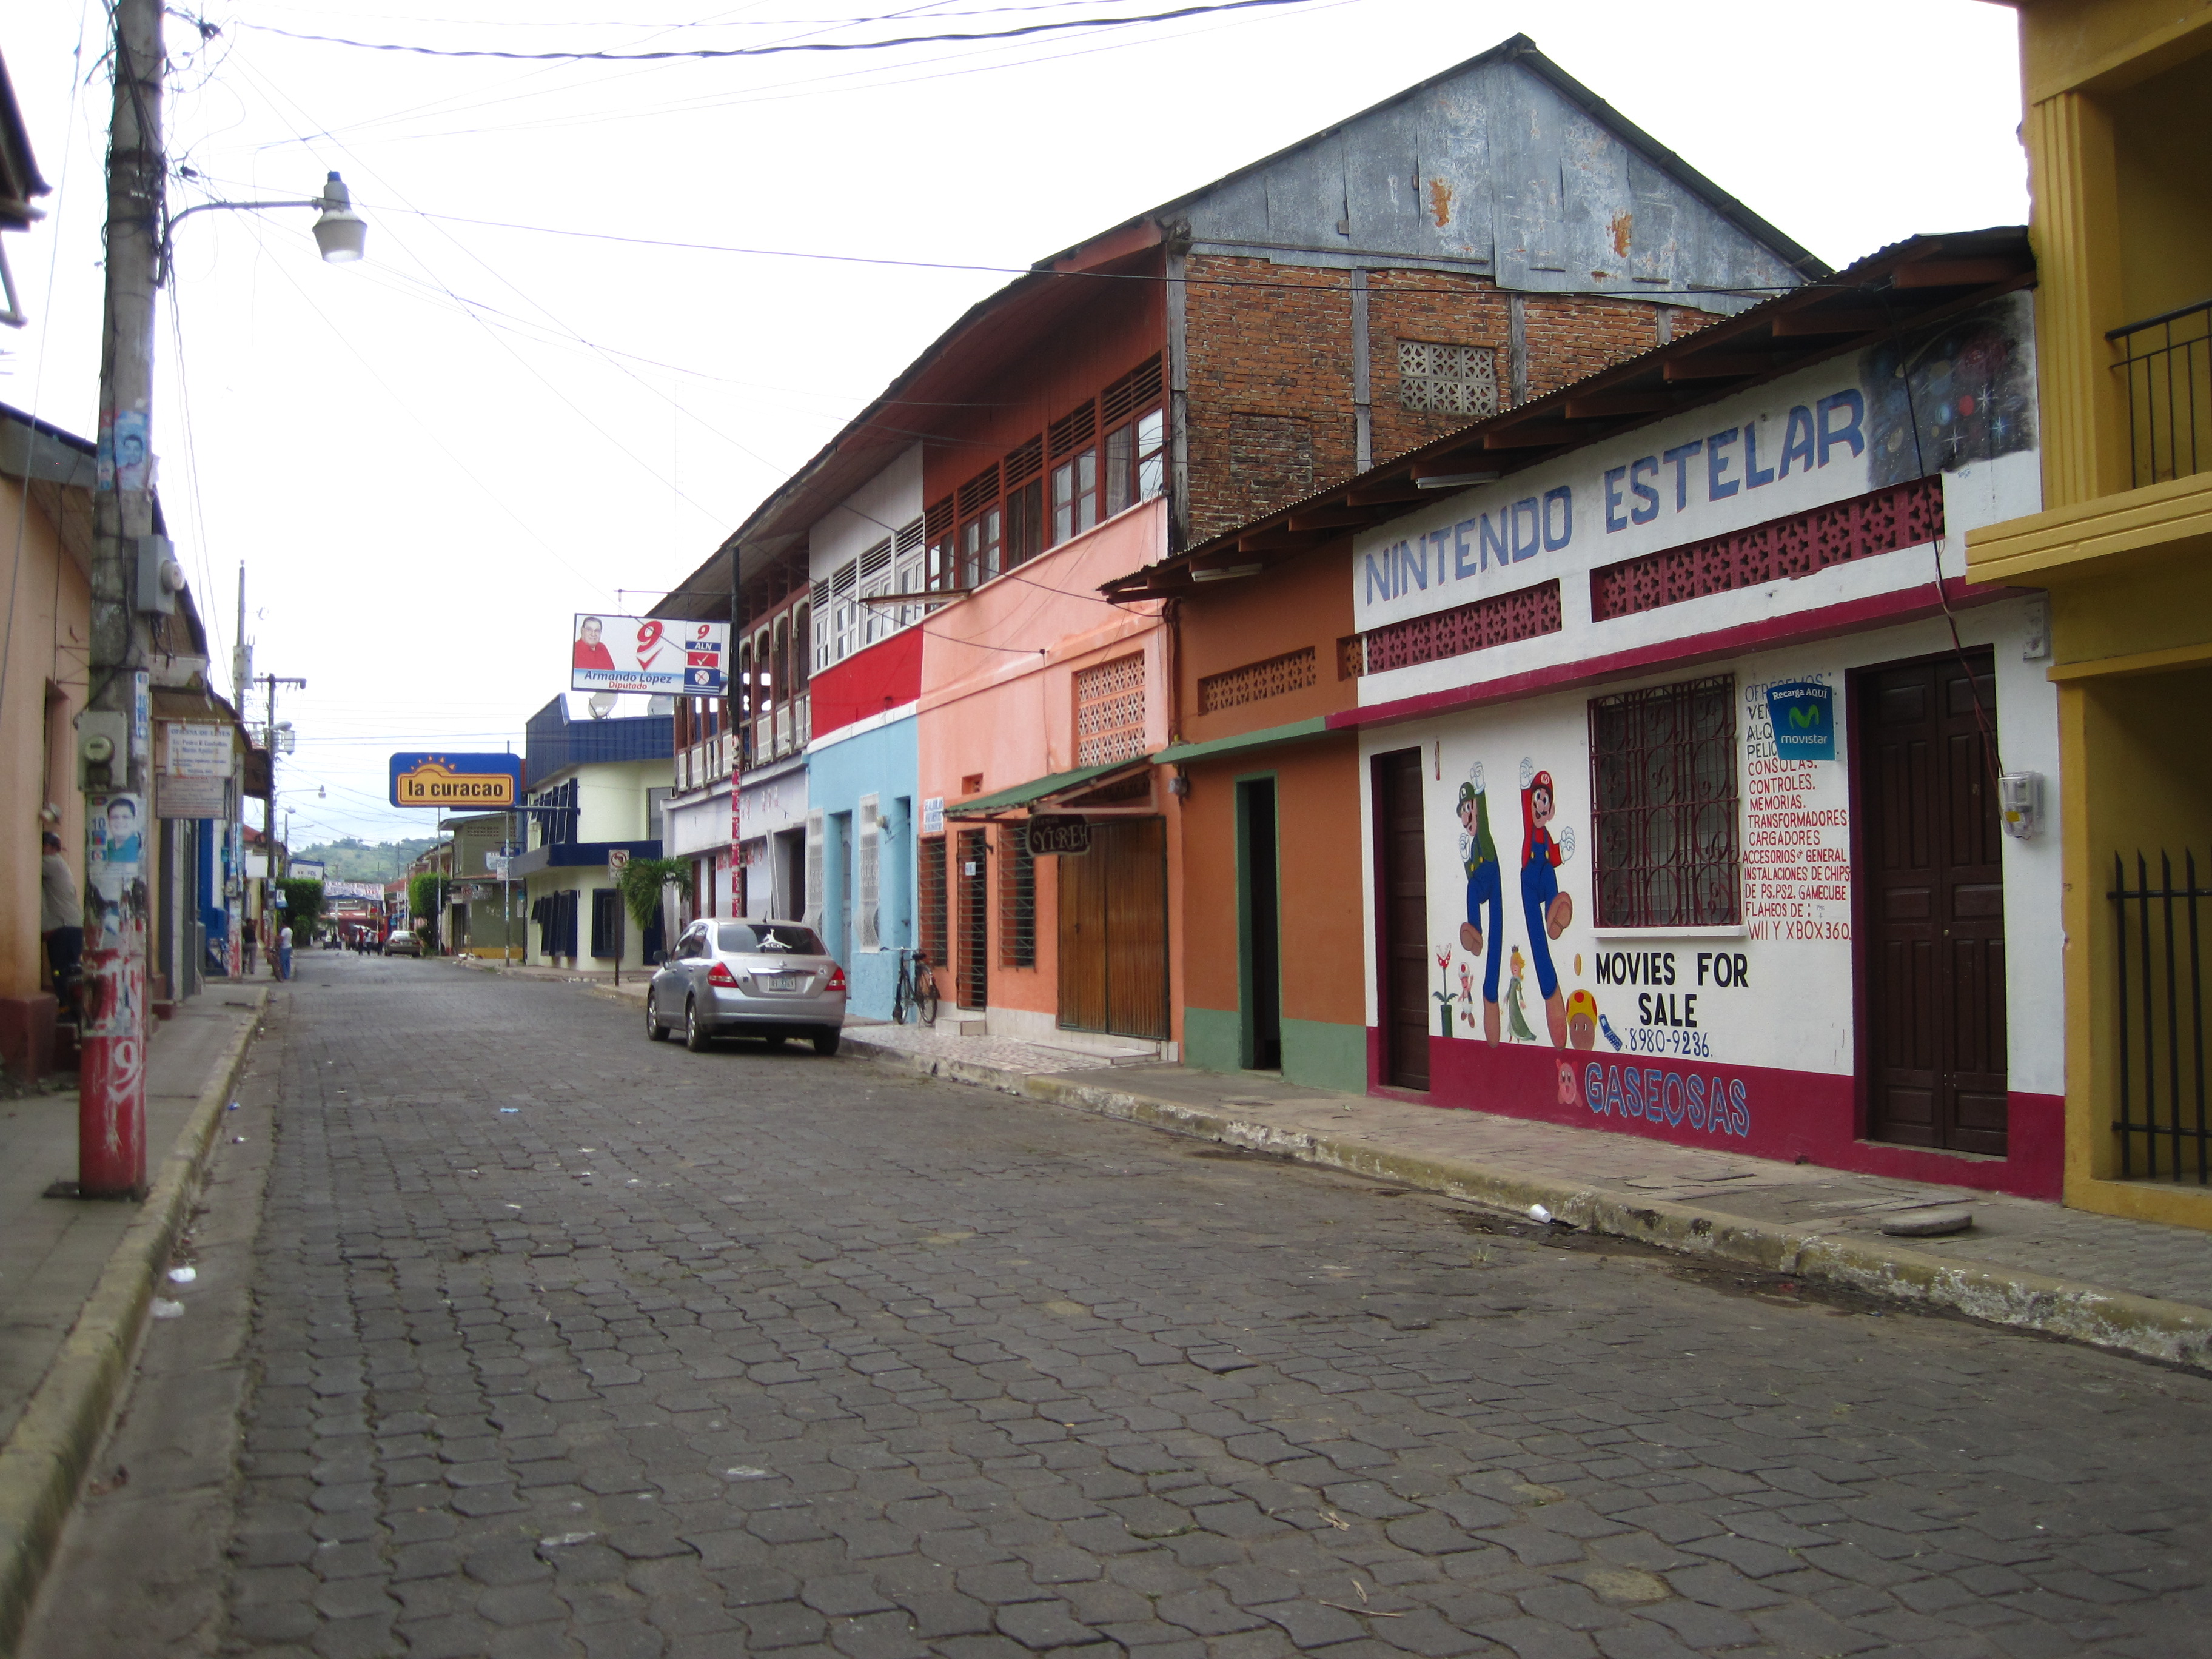
Morrito
Morrito is a municipality in the Río San Juan department of Nicaragua. As of 2009 the current mayor is Eda Medina. total population of the municipality is approximately 1,700 “town” residents and 5,000 rural inhabitants, with includes a total of abo..
Morrito Wikipedia Page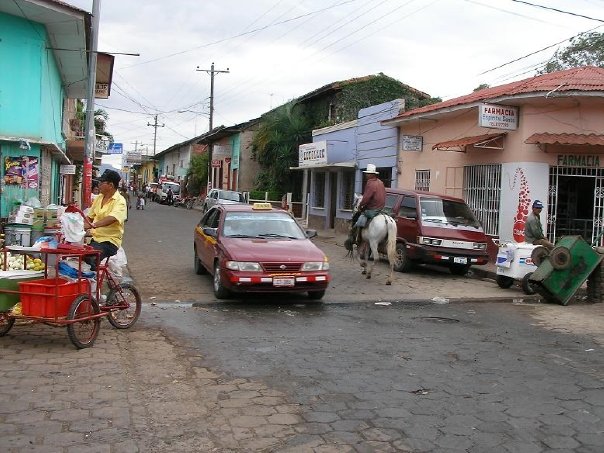

About Our Data
The data on this page is estimated using a number of publicly available tools and resources. It is provided without warranty, and could contain inaccuracies. Use at your own risk.