Categories in Nandaime
Industries
Business Distribution by Industry in Nandaime
| Industry Description | Number of Establishments |
|---|---|
| Churches | 24 |
| Grocery stores and supermarkets | 19 |
| Restaurants | 18 |
| Education | 12 |
| Pharmacies and drug stores | 11 |
| Shopping | 9 |
| Car repair | 8 |
| Religion | 8 |
| Hardware store | 7 |
| Bars, pubs and taverns | 7 |
| Cafes | 6 |
| Bakeries | 6 |
| Public parks | 6 |
| Hotels and motels | 6 |
Nandaime Facts
| Area | 322.8 km² |
| Population | 38,642 |
| Male Population | 19,209 (49.7%) |
| Female Population | 19,433 (50.3%) |
| Population change (1975 to 2020) | +38.5% |
| Population change (2000 to 2020) | +2.9% |
| Median Age | 20.3 years (Male: 19.7, Female: 21) |
| Area Codes | 24522 |
| Neighborhoods | Barrio Javier Guerra, Lotificación Privada, Barrio José Dolores Estrada, Barrio Monte Grande Occidental, Barrio Ricardo Morales Avilés |
| Local Time | |
| Timezone | Central Standard Time |
| Lat & Lng | 11.75696, -86.05286 |
Map of Nandaime
Interactive Map
Nandaime Population
Years 1975 to 2020
| Data | 1975 | 1990 | 2000 | 2015 | 2020 |
|---|---|---|---|---|---|
| Population | 27,892 | 35,338 | 37,549 | 36,906 | 38,642 |
| Population Density | 86.4 / km² | 109.5 / km² | 116.3 / km² | 114.3 / km² | 119.7 / km² |
Nandaime Population change from 2000 to 2015
Decrease of 1.7% from year 2000 to 2015
| Location | Change since 1975 | Change since 1990 | Change since 2000 |
|---|---|---|---|
| Nandaime | +32.3% | +4.4% | -1.7% |
| Granada Department | +52.3% | +13.4% | +2.8% |
| Nicaragua | +117.4% | +46.7% | +21% |
Nandaime Median Age
Median Age: 20.3 years
| Location | Median Age | Median Age (Female) | Median Age (Male) |
|---|---|---|---|
| Nandaime | 20.3 yrs | 21 yrs | 19.7 yrs |
| Granada Department | 21.5 yrs | 22.4 yrs | 20.6 yrs |
| Nicaragua | 20.4 yrs | 21.2 yrs | 19.7 yrs |
Nandaime Population Density
Population Density: 120 / km²
| Location | Population | Area | Density |
|---|---|---|---|
| Nandaime | 38,642 | 322.8 km² | 120 / km² |
| Granada Department | 182,823 | 1,064 km² | 172 / km² |
| Nicaragua | 6.1 million | 128,508.4 km² | 47.1 / km² |
Nandaime Historical and Projected Population
Estimated Population from 0 to 2100
- JRC (European Commission's Joint Research Centre) work on the GHS built-up grid
- CIESIN (Center for International Earth Science Information Network)
- [Link] Klein Goldewijk, K., Beusen, A., Doelman, J., and Stehfest, E.: Anthropogenic land use estimates for the Holocene – HYDE 3.2, Earth Syst. Sci. Data, 9, 927–953, https://doi.org/10.5194/essd-9-927-2017, 2017.
Neighborhoods in Nandaime
Percentage of businesses by neighborhood in Nandaime
Price Distribution
Business distribution by price for Nandaime
Human Development Index (HDI)
Statistic composite index of life expectancy, education, and per capita income.
Nandaime CO2 Emissions
Carbon Dioxide (CO2) Emissions Per Capita in Tonnes Per Year
| Location | CO2 Emissions | CO2 Emissions Per Capita | CO2 Emissions Intensity |
|---|---|---|---|
| Nandaime | 41,775 tn | 1.08 tn | 129.4 tons/km² |
| Granada Department | 198,440 tn | 1.09 tn | 186.5 tons/km² |
| Nicaragua | 5,658,022 tn | 0.93 tn | 44 tons/km² |
| 2013 CO2 emissions (tonnes/year) | 41,775 tn |
| 2013 CO2 emissions (tonnes/year) per capita | 1.08 tn |
| 2013 CO2 emissions intensity (tonnes/km²/year) | 129.4 tons/km² |
Natural Hazards Risk
Relative risk out of 10
| Hazard | Risk Level |
|---|---|
| Drought | High (9) |
| Flood | Medium (7) |
| Earthquake | High (8.5) |
| Cyclone | Medium (5) |
| Landslide | Medium (7) |
| Volcano | Medium (7) |
* Risk, particularly concerning flood or landslide, may not be for the entire area.
- Dilley, M., R.S. Chen, U. Deichmann, A.L. Lerner-Lam, M. Arnold, J. Agwe, P. Buys, O. Kjekstad, B. Lyon, and G. Yetman. 2005. Natural Disaster Hotspots: A Global Risk Analysis. Washington, D.C.: World Bank. https://doi.org/10.1596/0-8213-5930-4.
- Center for Hazards and Risk Research - CHRR - Columbia University, Center for International Earth Science Information Network - CIESIN - Columbia University, and Norwegian Geotechnical Institute - NGI. 2005. Global Landslide Hazard Distribution. Palisades, NY: NASA Socioeconomic Data and Applications Center (SEDAC). https://doi.org/10.7927/H4P848VZ.
- Center for Hazards and Risk Research - CHRR - Columbia University, Center for International Earth Science Information Network - CIESIN - Columbia University, International Bank for Reconstruction and Development - The World Bank, and United Nations Environment Programme Global Resource Information Database Geneva - UNEP/GRID-Geneva. 2005. Global Cyclone Hazard Frequency and Distribution. Palisades, NY: NASA Socioeconomic Data and Applications Center (SEDAC). https://doi.org/10.7927/H4CZ353K.
- Center for Hazards and Risk Research - CHRR - Columbia University, Center for International Earth Science Information Network - CIESIN - Columbia University, and International Research Institute for Climate and Society - IRI - Columbia University. 2005. Global Drought Hazard Frequency and Distribution. Palisades, NY: NASA Socioeconomic Data and Applications Center (SEDAC). https://doi.org/10.7927/H4VX0DFT.
- Center for Hazards and Risk Research - CHRR - Columbia University, Center for International Earth Science Information Network - CIESIN - Columbia University. 2005. Global Flood Hazard Frequency and Distribution. Palisades, NY: NASA Socioeconomic Data and Applications Center (SEDAC). https://doi.org/10.7927/H4668B3D.
- Center for Hazards and Risk Research - CHRR - Columbia University, Center for International Earth Science Information Network - CIESIN - Columbia University. 2005. Global Volcano Hazard Frequency and Distribution. Palisades, NY: NASA Socioeconomic Data and Applications Center (SEDAC). https://doi.org/10.7927/H4BR8Q45.
- Center for Hazards and Risk Research - CHRR - Columbia University, Center for International Earth Science Information Network - CIESIN - Columbia University. 2005. Global Earthquake Hazard Distribution - Peak Ground Acceleration. Palisades, NY: NASA Socioeconomic Data and Applications Center (SEDAC). https://doi.org/10.7927/H4BZ63ZS.
Recent Nearby Earthquakes
Magnitude 3.0 and greater
| Date▼ | Time↕ | Magnitude↕ | Distance↕ | Depth↕ | Location↕ | Link |
|---|---|---|---|---|---|---|
| 3/24/19 | 3:22 AM | 3.7 | 30.5 km | 73,530 m | 16km SSW of Santa Teresa, Nicaragua | usgs.gov |
| 5/6/18 | 5:19 AM | 4.8 | 17.9 km | 149,510 m | 5km SSW of Jinotepe, Nicaragua | usgs.gov |
| 3/12/18 | 6:44 AM | 4.6 | 19.6 km | 164,720 m | 0km NW of Jinotepe, Nicaragua | usgs.gov |
| 4/28/17 | 7:53 AM | 4.6 | 18.5 km | 177,130 m | 14km NNW of Belen, Nicaragua | usgs.gov |
| 1/8/17 | 6:25 PM | 4.6 | 14.5 km | 115,580 m | 5km SE of Santa Teresa, Nicaragua | usgs.gov |
| 10/8/16 | 11:20 PM | 4.2 | 22.9 km | 129,820 m | 6km SW of Santa Teresa, Nicaragua | usgs.gov |
| 9/27/16 | 8:39 PM | 4.9 | 10.5 km | 180,420 m | 10km E of Nandaime, Nicaragua | usgs.gov |
| 5/28/16 | 4:42 PM | 4.4 | 27.5 km | 170,790 m | 5km NW of Belen, Nicaragua | usgs.gov |
| 5/10/15 | 4:27 AM | 3.3 | 28.1 km | 5,000 m | 3km NW of La Concepcion, Nicaragua | usgs.gov |
| 12/2/14 | 9:29 AM | 4.4 | 22.6 km | 173,000 m | 11km NW of Belen, Nicaragua | usgs.gov |
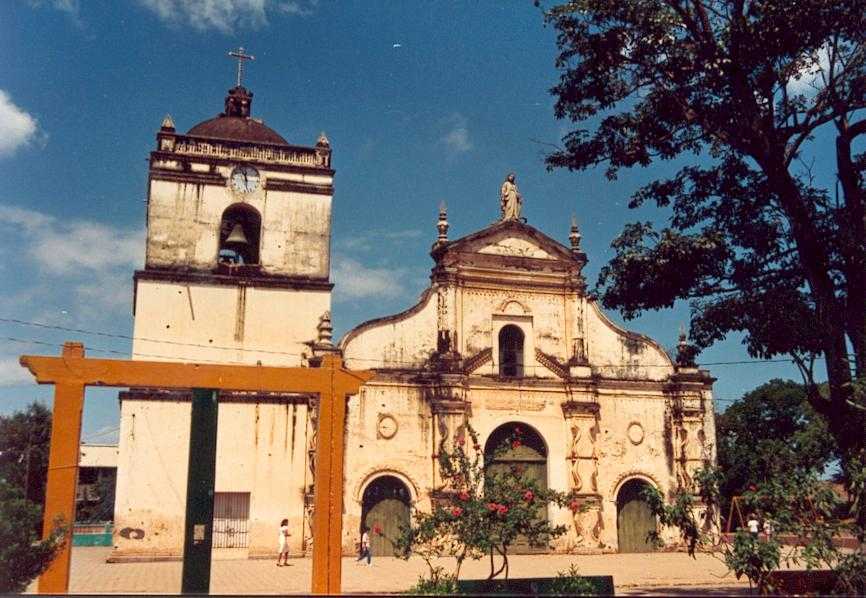
Nandaime
Nandaime is a municipality in the Granada department of Nicaragua. is a small town in Southwest of the country. It is located on the Panamerican highway which crosses the Pacific area of Nicaragua, at a distance of 67 km from Managua, capital of the..
Nandaime Wikipedia Page

About Our Data
The data on this page is estimated using a number of publicly available tools and resources. It is provided without warranty, and could contain inaccuracies. Use at your own risk.