Categories in Anloo
Map of Anloo
Interactive Map
Anloo Population
Years 1975 to 2020
| Data | 1975 | 1990 | 2000 | 2015 | 2020 |
|---|---|---|---|---|---|
| Population | 249 | 246 | 235 | 242 | 238 |
| Population Density | 664 / km² | 656 / km² | 626.7 / km² | 645.3 / km² | 634.7 / km² |
Anloo Population change from 2000 to 2015
Increase of 3% from year 2000 to 2015
| Location | Change since 1975 | Change since 1990 | Change since 2000 |
|---|---|---|---|
| Anloo | -2.8% | -1.6% | +3% |
| Drenthe | +22.4% | +11.9% | +5.4% |
| Netherlands | +24.3% | +13.4% | +6.5% |
Anloo Population Density
Population Density: 635 / km²
| Location | Population | Area | Density |
|---|---|---|---|
| Anloo | 238 | 0.375 km² | 635 / km² |
| Drenthe | 497,820 | 2,678.3 km² | 186 / km² |
| Netherlands | 16.9 million | 41,398.3 km² | 409 / km² |
Anloo Historical and Projected Population
Estimated Population from 1300 to 2100
- JRC (European Commission's Joint Research Centre) work on the GHS built-up grid
- CIESIN (Center for International Earth Science Information Network)
- [Link] Klein Goldewijk, K., Beusen, A., Doelman, J., and Stehfest, E.: Anthropogenic land use estimates for the Holocene – HYDE 3.2, Earth Syst. Sci. Data, 9, 927–953, https://doi.org/10.5194/essd-9-927-2017, 2017.
Area Codes
Percentage Area Codes used by businesses in Anloo
Price Distribution
Business distribution by price for Anloo
Human Development Index (HDI)
Statistic composite index of life expectancy, education, and per capita income.
Anloo CO2 Emissions
Carbon Dioxide (CO2) Emissions Per Capita in Tonnes Per Year
| Location | CO2 Emissions | CO2 Emissions Per Capita | CO2 Emissions Intensity |
|---|---|---|---|
| Anloo | 2,776 tn | 11.66 tn | 7,401.4 tons/km² |
| Drenthe | 5,666,833 tn | 11.38 tn | 2,115.8 tons/km² |
| Netherlands | 167,743,568 tn | 9.91 tn | 4,051.9 tons/km² |
| 2013 CO2 emissions (tonnes/year) | 2,776 tn |
| 2013 CO2 emissions (tonnes/year) per capita | 11.66 tn |
| 2013 CO2 emissions intensity (tonnes/km²/year) | 7,401.4 tons/km² |
Recent Nearby Earthquakes
Magnitude 3.0 and greater
| Date▼ | Time↕ | Magnitude↕ | Distance↕ | Depth↕ | Location↕ | Link |
|---|---|---|---|---|---|---|
| 5/22/19 | 3:48 AM | 3.2 | 39.6 km | 10,000 m | 8km NNE of Winsum, Netherlands | usgs.gov |
| 2/7/13 | 11:19 PM | 3.4 | 41 km | 10,000 m | 11km NNE of Winsum, Netherlands | usgs.gov |
| 8/16/12 | 8:30 PM | 3.4 | 33.3 km | 3,000 m | The Netherlands | usgs.gov |
| 10/30/08 | 5:54 AM | 3.3 | 37.7 km | 3,000 m | The Netherlands | usgs.gov |
| 3/20/07 | 7:54 PM | 3.7 | 97.5 km | 10,000 m | Germany | usgs.gov |
| 8/8/06 | 5:03 AM | 3.8 | 37.2 km | 10,000 m | The Netherlands | usgs.gov |
| 7/2/06 | 2:37 PM | 3 | 79.6 km | 5,000 m | Germany | usgs.gov |
| 6/21/04 | 11:32 PM | 3 | 28.5 km | 5,000 m | The Netherlands | usgs.gov |
| 11/10/03 | 12:22 AM | 3.1 | 45.6 km | 10,000 m | The Netherlands | usgs.gov |
| 2/19/97 | 9:53 PM | 3 | 7.5 km | 5,000 m | The Netherlands | usgs.gov |
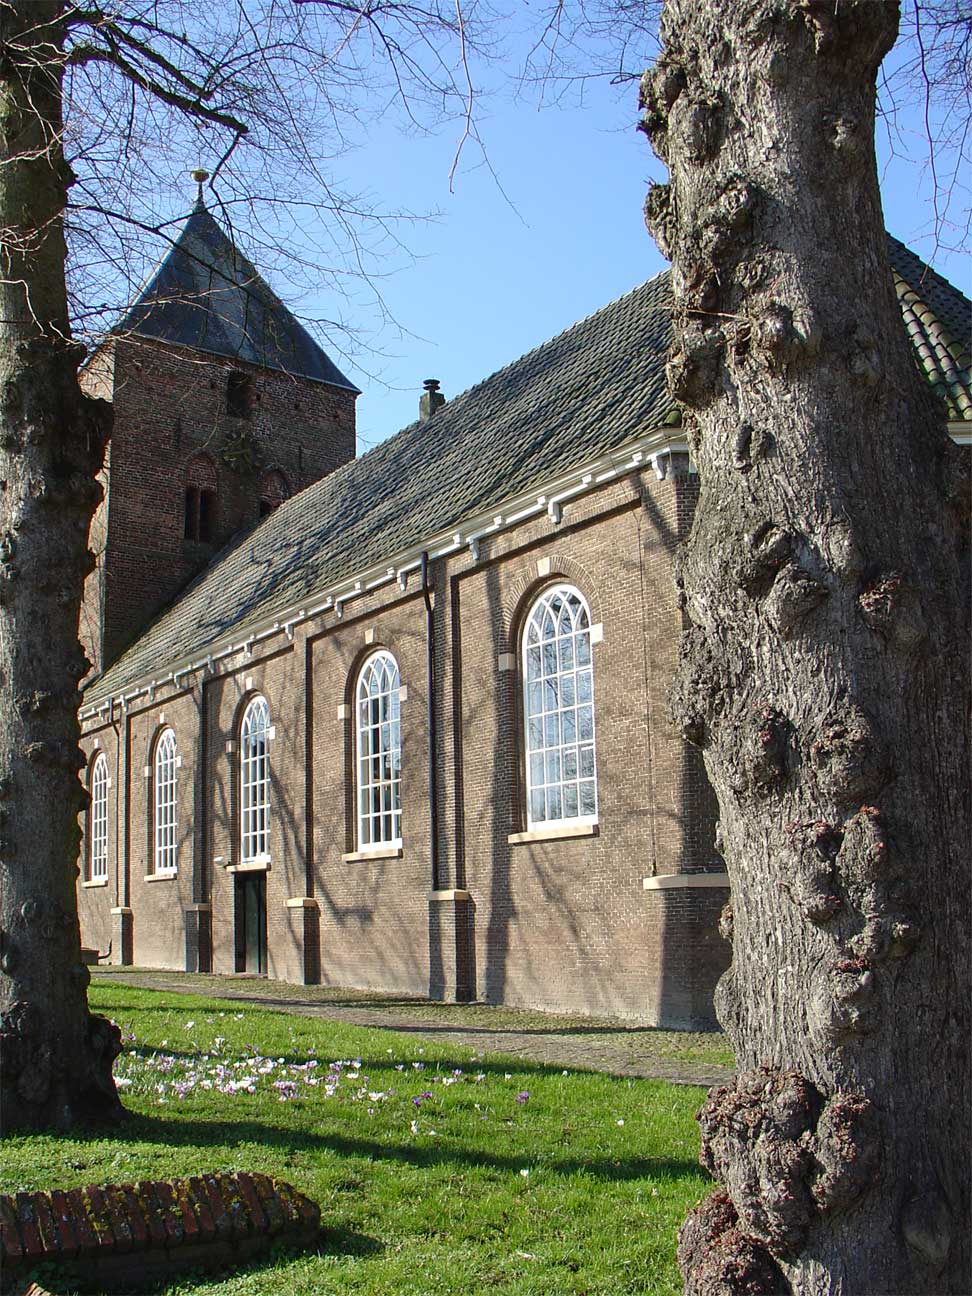
Anloo
Anloo is a village in the Dutch province of Drenthe. It is a part of the municipality of Aa en Hunze, and lies about 10 km east of Assen. 2001, the village of Anloo had 225 inhabitants. The built-up area of the village was 0.12 km², and contained 98..
Anloo Wikipedia Page


About Our Data
The data on this page is estimated using a number of publicly available tools and resources. It is provided without warranty, and could contain inaccuracies. Use at your own risk.