Categories in Brielle
Industries
Business Distribution by Industry in Brielle
| Industry Description | Number of Establishments |
|---|---|
| Construction of buildings | 118 |
| Corporate management | 90 |
| Shopping | 68 |
| Restaurants | 67 |
| Beauty salons | 61 |
| Accountants | 59 |
| Electronics stores | 50 |
| Real estate | 44 |
| Clothing stores | 42 |
| Specialized design | 38 |
| Other construction | 36 |
Brielle Facts
| Area | 11.5 km² |
| Population | 8,993 |
| Male Population | 4,470 (49.7%) |
| Female Population | 4,523 (50.3%) |
| Population change (1975 to 2020) | -0.1% |
| Population change (2000 to 2020) | +0.9% |
| Median Age | 43.6 years (Male: 42.9, Female: 44.3) |
| Neighborhoods | Centrum, Europoort, Leyenburg, Zevenkamp, Feijenoord |
| Local Time | |
| Timezone | Central European Summer Time |
| Lat & Lng | 51.90167, 4.16250 |
| Postal Codes | 3198, 3231, 3232, 3233, 3237 |
Map of Brielle
Interactive Map
Brielle Population
Years 1975 to 2020
| Data | 1975 | 1990 | 2000 | 2015 | 2020 |
|---|---|---|---|---|---|
| Population | 9,002 | 8,937 | 8,917 | 8,799 | 8,993 |
| Population Density | 782.8 / km² | 777.1 / km² | 775.4 / km² | 765.1 / km² | 782 / km² |
Brielle Population change from 2000 to 2015
Decrease of 1.3% from year 2000 to 2015
| Location | Change since 1975 | Change since 1990 | Change since 2000 |
|---|---|---|---|
| Brielle | -2.3% | -1.5% | -1.3% |
| South Holland | +21.1% | +12.1% | +5.9% |
| Netherlands | +24.3% | +13.4% | +6.5% |
Brielle Median Age
Median Age: 43.6 years
| Location | Median Age | Median Age (Female) | Median Age (Male) |
|---|---|---|---|
| Brielle | 43.6 yrs | 44.3 yrs | 42.9 yrs |
| South Holland | 40 yrs | 40.9 yrs | 39.1 yrs |
| Netherlands | 41 yrs | 41.7 yrs | 40.2 yrs |
Brielle Population Density
Population Density: 782 / km²
| Location | Population | Area | Density |
|---|---|---|---|
| Brielle | 8,993 | 11.5 km² | 782 / km² |
| South Holland | 3.6 million | 3,417.4 km² | 1,048 / km² |
| Netherlands | 16.9 million | 41,398.3 km² | 409 / km² |
Brielle Historical and Projected Population
Estimated Population from 1500 to 2100
- JRC (European Commission's Joint Research Centre) work on the GHS built-up grid
- CIESIN (Center for International Earth Science Information Network)
- [Link] Klein Goldewijk, K., Beusen, A., Doelman, J., and Stehfest, E.: Anthropogenic land use estimates for the Holocene – HYDE 3.2, Earth Syst. Sci. Data, 9, 927–953, https://doi.org/10.5194/essd-9-927-2017, 2017.
Neighborhoods in Brielle
Percentage of businesses by neighborhood in Brielle
Area Codes
Percentage Area Codes used by businesses in Brielle
Postal Codes
Percentage of businesses by Postal Codes in Brielle
Price Distribution
Business distribution by price for Brielle
Human Development Index (HDI)
Statistic composite index of life expectancy, education, and per capita income.
Brielle CO2 Emissions
Carbon Dioxide (CO2) Emissions Per Capita in Tonnes Per Year
| Location | CO2 Emissions | CO2 Emissions Per Capita | CO2 Emissions Intensity |
|---|---|---|---|
| Brielle | 103,430 tn | 11.5 tn | 8,993.9 tons/km² |
| South Holland | 38,003,786 tn | 10.61 tn | 11,120.8 tons/km² |
| Netherlands | 167,743,568 tn | 9.91 tn | 4,051.9 tons/km² |
| 2013 CO2 emissions (tonnes/year) | 103,430 tn |
| 2013 CO2 emissions (tonnes/year) per capita | 11.5 tn |
| 2013 CO2 emissions intensity (tonnes/km²/year) | 8,993.9 tons/km² |
Recent Nearby Earthquakes
Magnitude 3.0 and greater
| Date▼ | Time↕ | Magnitude↕ | Distance↕ | Depth↕ | Location↕ | Link |
|---|---|---|---|---|---|---|
| 9/10/01 | 4:30 AM | 3.4 | 67 km | 10,000 m | The Netherlands | usgs.gov |
| 9/9/01 | 6:58 AM | 3.8 | 82.6 km | 10,000 m | The Netherlands | usgs.gov |
| 7/28/95 | 7:24 PM | 4 | 98.5 km | 10,000 m | The Netherlands | usgs.gov |
| 9/21/94 | 1:12 AM | 3.4 | 76.5 km | 5,000 m | The Netherlands | usgs.gov |
| 8/6/94 | 6:02 PM | 3 | 76.3 km | 10,000 m | The Netherlands | usgs.gov |
| 12/1/89 | 8:09 PM | 3.1 | 66.9 km | 10,000 m | The Netherlands | usgs.gov |
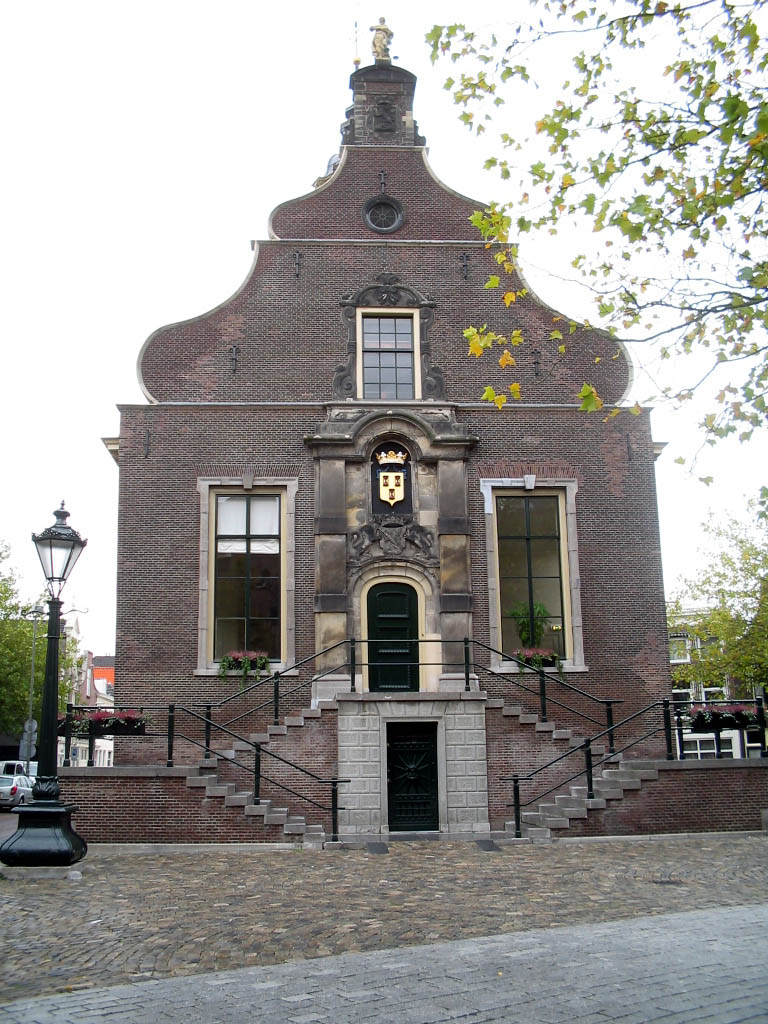
Brielle
Brielle ( pronunciation ), also called Den Briel (Brill in English) is a town, municipality and historic seaport in the western Netherlands, in the province of South Holland, on the north side of the island of Voorne-Putten, at the mouth of the New M..
Brielle Wikipedia Page


About Our Data
The data on this page is estimated using a number of publicly available tools and resources. It is provided without warranty, and could contain inaccuracies. Use at your own risk.