Categories in Drachten
Industries
Business Distribution by Industry in Drachten
| Industry Description | Number of Establishments | Average Age of Business |
|---|---|---|
| Corporate management | 375 | 26 years |
| Construction of buildings | 372 | — |
| Shopping | 281 | 21 years |
| Restaurants | 204 | 28 years |
| Electronics stores | 193 | 29 years |
| Other construction | 192 | — |
| Loan companies | 171 | — |
| Health and medical | 161 | — |
| Accountants | 159 | — |
| Beauty salons | 154 | 20 years |
| Education | 125 | — |
Drachten Facts
| Area | 24.1 km² |
| Population | 43,656 |
| Male Population | 21,652 (49.6%) |
| Female Population | 22,004 (50.4%) |
| Population change (1975 to 2020) | +17.6% |
| Population change (2000 to 2020) | +2.5% |
| Median Age | 41.7 years (Male: 40.6, Female: 42.9) |
| Area Codes | 512 |
| Neighborhoods | Euvelgunne, Binnenstad, Almere Stad, Grote Markt, Holtenbroek |
| Local Time | |
| Timezone | Central European Summer Time |
| Lat & Lng | 53.11254, 6.09890 |
| Postal Codes | 9201, 9202, 9203, 9204, 9205, More |
Map of Drachten
Interactive Map
Drachten Population
Years 1975 to 2020
| Data | 1975 | 1990 | 2000 | 2015 | 2020 |
|---|---|---|---|---|---|
| Population | 37,127 | 40,617 | 42,573 | 42,783 | 43,656 |
| Population Density | 1,538.9 / km² | 1,683.6 / km² | 1,764.7 / km² | 1,773.4 / km² | 1,809.6 / km² |
Drachten Population change from 2000 to 2015
Increase of 0.5% from year 2000 to 2015
| Location | Change since 1975 | Change since 1990 | Change since 2000 |
|---|---|---|---|
| Drachten | +15.2% | +5.3% | +0.5% |
| Friesland | +18.8% | +9.6% | +4.1% |
| Netherlands | +24.3% | +13.4% | +6.5% |
Drachten Median Age
Median Age: 41.7 years
| Location | Median Age | Median Age (Female) | Median Age (Male) |
|---|---|---|---|
| Drachten | 41.7 yrs | 42.9 yrs | 40.6 yrs |
| Friesland | 41.9 yrs | 42.9 yrs | 41 yrs |
| Netherlands | 41 yrs | 41.7 yrs | 40.2 yrs |
Drachten Population Density
Population Density: 1,810 / km²
| Location | Population | Area | Density |
|---|---|---|---|
| Drachten | 43,656 | 24.1 km² | 1,810 / km² |
| Friesland | 653,256 | 5,751.4 km² | 114 / km² |
| Netherlands | 16.9 million | 41,398.3 km² | 409 / km² |
Drachten Historical and Projected Population
Estimated Population from 800 to 2100
- JRC (European Commission's Joint Research Centre) work on the GHS built-up grid
- CIESIN (Center for International Earth Science Information Network)
- [Link] Klein Goldewijk, K., Beusen, A., Doelman, J., and Stehfest, E.: Anthropogenic land use estimates for the Holocene – HYDE 3.2, Earth Syst. Sci. Data, 9, 927–953, https://doi.org/10.5194/essd-9-927-2017, 2017.
Neighborhoods in Drachten
Percentage of businesses by neighborhood in Drachten
Area Codes
Percentage Area Codes used by businesses in Drachten
Postal Codes
Percentage of businesses by Postal Codes in Drachten
Price Distribution
Business distribution by price for Drachten
Human Development Index (HDI)
Statistic composite index of life expectancy, education, and per capita income.
Drachten CO2 Emissions
Carbon Dioxide (CO2) Emissions Per Capita in Tonnes Per Year
| Location | CO2 Emissions | CO2 Emissions Per Capita | CO2 Emissions Intensity |
|---|---|---|---|
| Drachten | 486,492 tn | 11.14 tn | 20,165.5 tons/km² |
| Friesland | 4,518,084 tn | 6.92 tn | 785.6 tons/km² |
| Netherlands | 167,743,568 tn | 9.91 tn | 4,051.9 tons/km² |
| 2013 CO2 emissions (tonnes/year) | 486,492 tn |
| 2013 CO2 emissions (tonnes/year) per capita | 11.14 tn |
| 2013 CO2 emissions intensity (tonnes/km²/year) | 20,165.5 tons/km² |
Recent Nearby Earthquakes
Magnitude 3.0 and greater
| Date▼ | Time↕ | Magnitude↕ | Distance↕ | Depth↕ | Location↕ | Link |
|---|---|---|---|---|---|---|
| 5/22/19 | 3:48 AM | 3.2 | 45.1 km | 10,000 m | 8km NNE of Winsum, Netherlands | usgs.gov |
| 2/7/13 | 11:19 PM | 3.4 | 48.2 km | 10,000 m | 11km NNE of Winsum, Netherlands | usgs.gov |
| 8/16/12 | 8:30 PM | 3.4 | 50.5 km | 3,000 m | The Netherlands | usgs.gov |
| 10/30/08 | 5:54 AM | 3.3 | 44.7 km | 3,000 m | The Netherlands | usgs.gov |
| 8/8/06 | 5:03 AM | 3.8 | 40.4 km | 10,000 m | The Netherlands | usgs.gov |
| 6/21/04 | 11:32 PM | 3 | 35.4 km | 5,000 m | The Netherlands | usgs.gov |
| 11/10/03 | 12:22 AM | 3.1 | 33.2 km | 10,000 m | The Netherlands | usgs.gov |
| 2/19/97 | 9:53 PM | 3 | 45.1 km | 5,000 m | The Netherlands | usgs.gov |
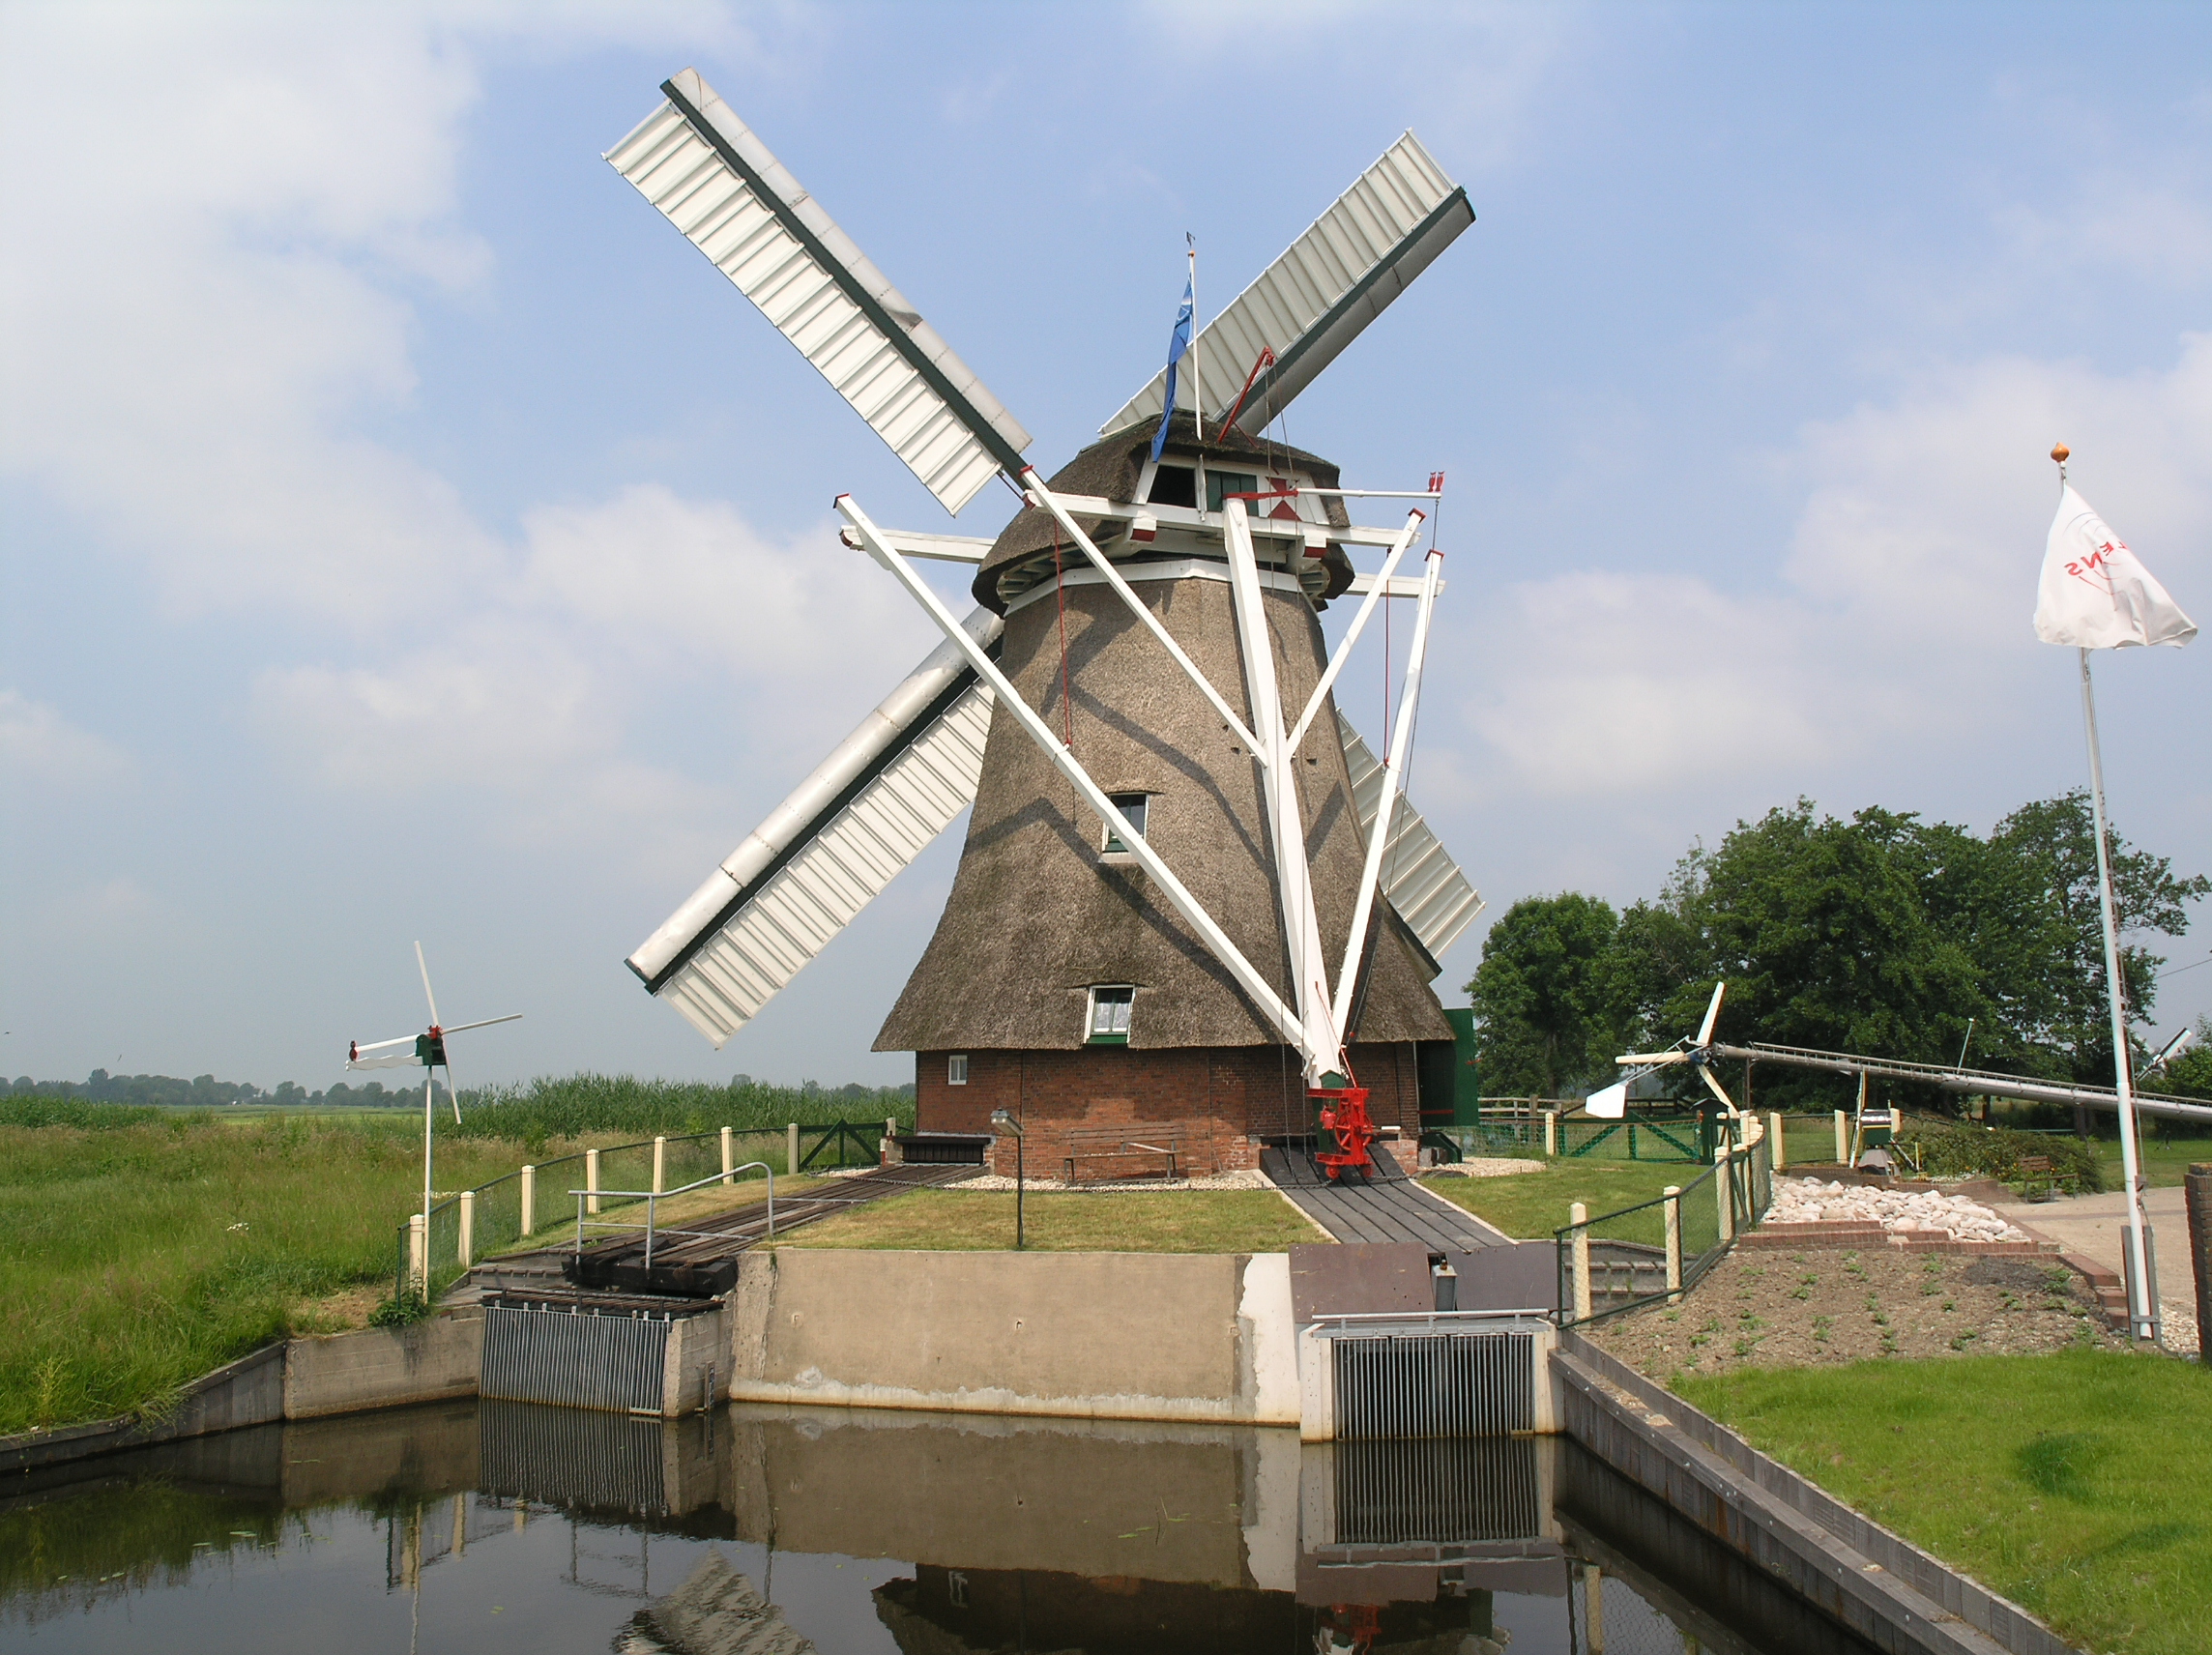
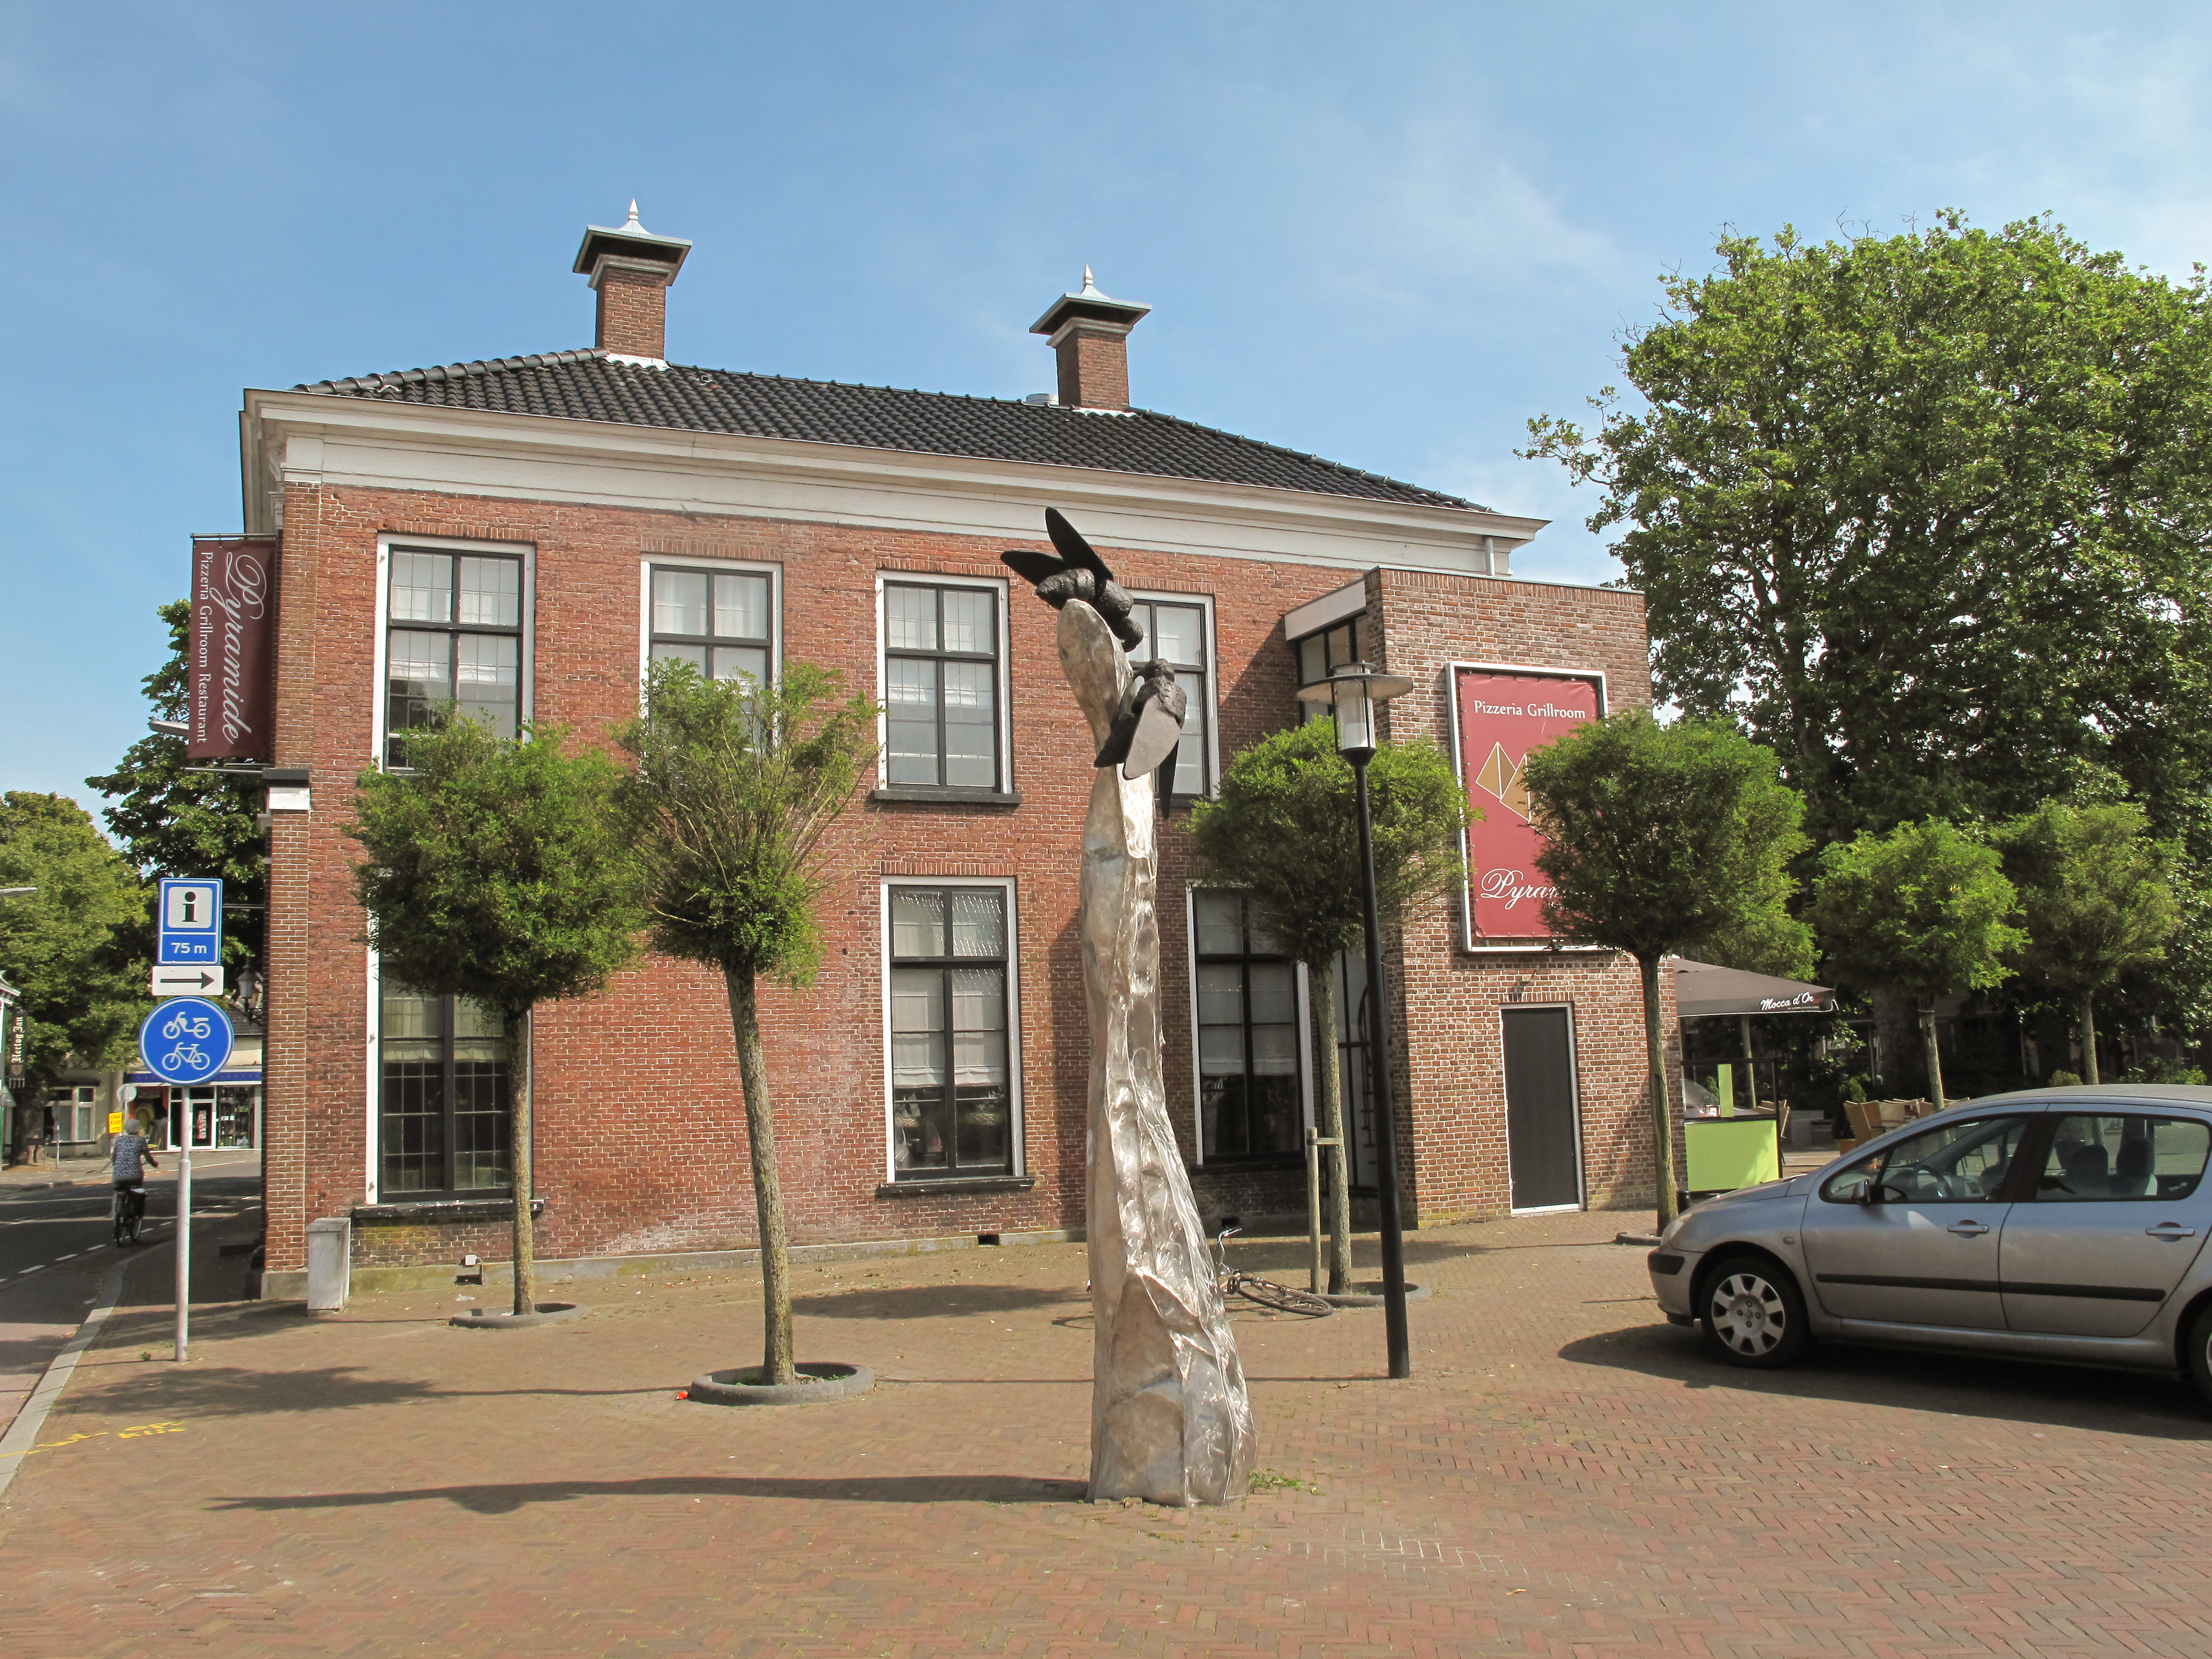
Drachten
, in the northeastern Netherlands, is a Dutch town, located in the municipality of Smallingerland in the province of Friesland. It is the second largest town in Friesland. Drachten is not connected by the Dutch railway system but it is along the imp..
Drachten Wikipedia Page

About Our Data
The data on this page is estimated using a number of publicly available tools and resources. It is provided without warranty, and could contain inaccuracies. Use at your own risk.