Categories in Pijnacker
Industries
Business Distribution by Industry in Pijnacker
| Industry Description | Number of Establishments | Average Age of Business |
|---|---|---|
| Construction of buildings | 292 | — |
| Corporate management | 188 | 35 years |
| Shopping | 123 | — |
| Other construction | 104 | — |
| Beauty salons | 82 | — |
| Accountants | 74 | — |
| Electronics stores | 74 | — |
| General contractors | 61 | — |
| Florists | 58 | — |
| All food and beverage | 57 | — |
Pijnacker Facts
| Area | 28.9 km² |
| Population | 36,611 |
| Male Population | 18,308 (50.0%) |
| Female Population | 18,303 (50.0%) |
| Population change (1975 to 2020) | +264.2% |
| Population change (2000 to 2020) | +62.5% |
| Median Age | 38.2 years (Male: 37.9, Female: 38.4) |
| Area Codes | 15 |
| Neighborhoods | Rokkeveen, Plaspoelpolder, De Bras, Moerwijk, Groot-IJsselmonde |
| Local Time | |
| Timezone | Central European Summer Time |
| Lat & Lng | 52.01954, 4.42946 |
| Postal Codes | 2641, 2642, 2643, 2645 |
Map of Pijnacker
Interactive Map
Pijnacker Population
Years 1975 to 2020
| Data | 1975 | 1990 | 2000 | 2015 | 2020 |
|---|---|---|---|---|---|
| Population | 10,052 | 16,908 | 22,528 | 35,522 | 36,611 |
| Population Density | 347.4 / km² | 584.3 / km² | 778.5 / km² | 1,227.5 / km² | 1,265.2 / km² |
Pijnacker Population change from 2000 to 2015
Increase of 57.7% from year 2000 to 2015
| Location | Change since 1975 | Change since 1990 | Change since 2000 |
|---|---|---|---|
| Pijnacker | +253.4% | +110.1% | +57.7% |
| South Holland | +21.1% | +12.1% | +5.9% |
| Netherlands | +24.3% | +13.4% | +6.5% |
Pijnacker Median Age
Median Age: 38.2 years
| Location | Median Age | Median Age (Female) | Median Age (Male) |
|---|---|---|---|
| Pijnacker | 38.2 yrs | 38.4 yrs | 37.9 yrs |
| South Holland | 40 yrs | 40.9 yrs | 39.1 yrs |
| Netherlands | 41 yrs | 41.7 yrs | 40.2 yrs |
Pijnacker Population Density
Population Density: 1,265 / km²
| Location | Population | Area | Density |
|---|---|---|---|
| Pijnacker | 36,611 | 28.9 km² | 1,265 / km² |
| South Holland | 3.6 million | 3,417.4 km² | 1,048 / km² |
| Netherlands | 16.9 million | 41,398.3 km² | 409 / km² |
Pijnacker Historical and Projected Population
Estimated Population from 1720 to 2100
- JRC (European Commission's Joint Research Centre) work on the GHS built-up grid
- CIESIN (Center for International Earth Science Information Network)
- [Link] Klein Goldewijk, K., Beusen, A., Doelman, J., and Stehfest, E.: Anthropogenic land use estimates for the Holocene – HYDE 3.2, Earth Syst. Sci. Data, 9, 927–953, https://doi.org/10.5194/essd-9-927-2017, 2017.
Neighborhoods in Pijnacker
Percentage of businesses by neighborhood in Pijnacker
Area Codes
Percentage Area Codes used by businesses in Pijnacker
Postal Codes
Percentage of businesses by Postal Codes in Pijnacker
Price Distribution
Business distribution by price for Pijnacker
Human Development Index (HDI)
Statistic composite index of life expectancy, education, and per capita income.
Pijnacker CO2 Emissions
Carbon Dioxide (CO2) Emissions Per Capita in Tonnes Per Year
| Location | CO2 Emissions | CO2 Emissions Per Capita | CO2 Emissions Intensity |
|---|---|---|---|
| Pijnacker | 428,516 tn | 11.7 tn | 14,808.3 tons/km² |
| South Holland | 38,003,786 tn | 10.61 tn | 11,120.8 tons/km² |
| Netherlands | 167,743,568 tn | 9.91 tn | 4,051.9 tons/km² |
| 2013 CO2 emissions (tonnes/year) | 428,516 tn |
| 2013 CO2 emissions (tonnes/year) per capita | 11.7 tn |
| 2013 CO2 emissions intensity (tonnes/km²/year) | 14,808.3 tons/km² |
Recent Nearby Earthquakes
Magnitude 3.0 and greater
| Date▼ | Time↕ | Magnitude↕ | Distance↕ | Depth↕ | Location↕ | Link |
|---|---|---|---|---|---|---|
| 9/10/01 | 4:30 AM | 3.4 | 51 km | 10,000 m | The Netherlands | usgs.gov |
| 9/9/01 | 6:58 AM | 3.8 | 66.1 km | 10,000 m | The Netherlands | usgs.gov |
| 9/11/99 | 12:32 PM | 3.7 | 92.2 km | 10,000 m | The Netherlands | usgs.gov |
| 7/28/95 | 7:24 PM | 4 | 85.2 km | 10,000 m | The Netherlands | usgs.gov |
| 9/21/94 | 1:12 AM | 3.4 | 60.9 km | 5,000 m | The Netherlands | usgs.gov |
| 8/6/94 | 6:02 PM | 3 | 56.2 km | 10,000 m | The Netherlands | usgs.gov |
| 12/1/89 | 8:09 PM | 3.1 | 45.2 km | 10,000 m | The Netherlands | usgs.gov |
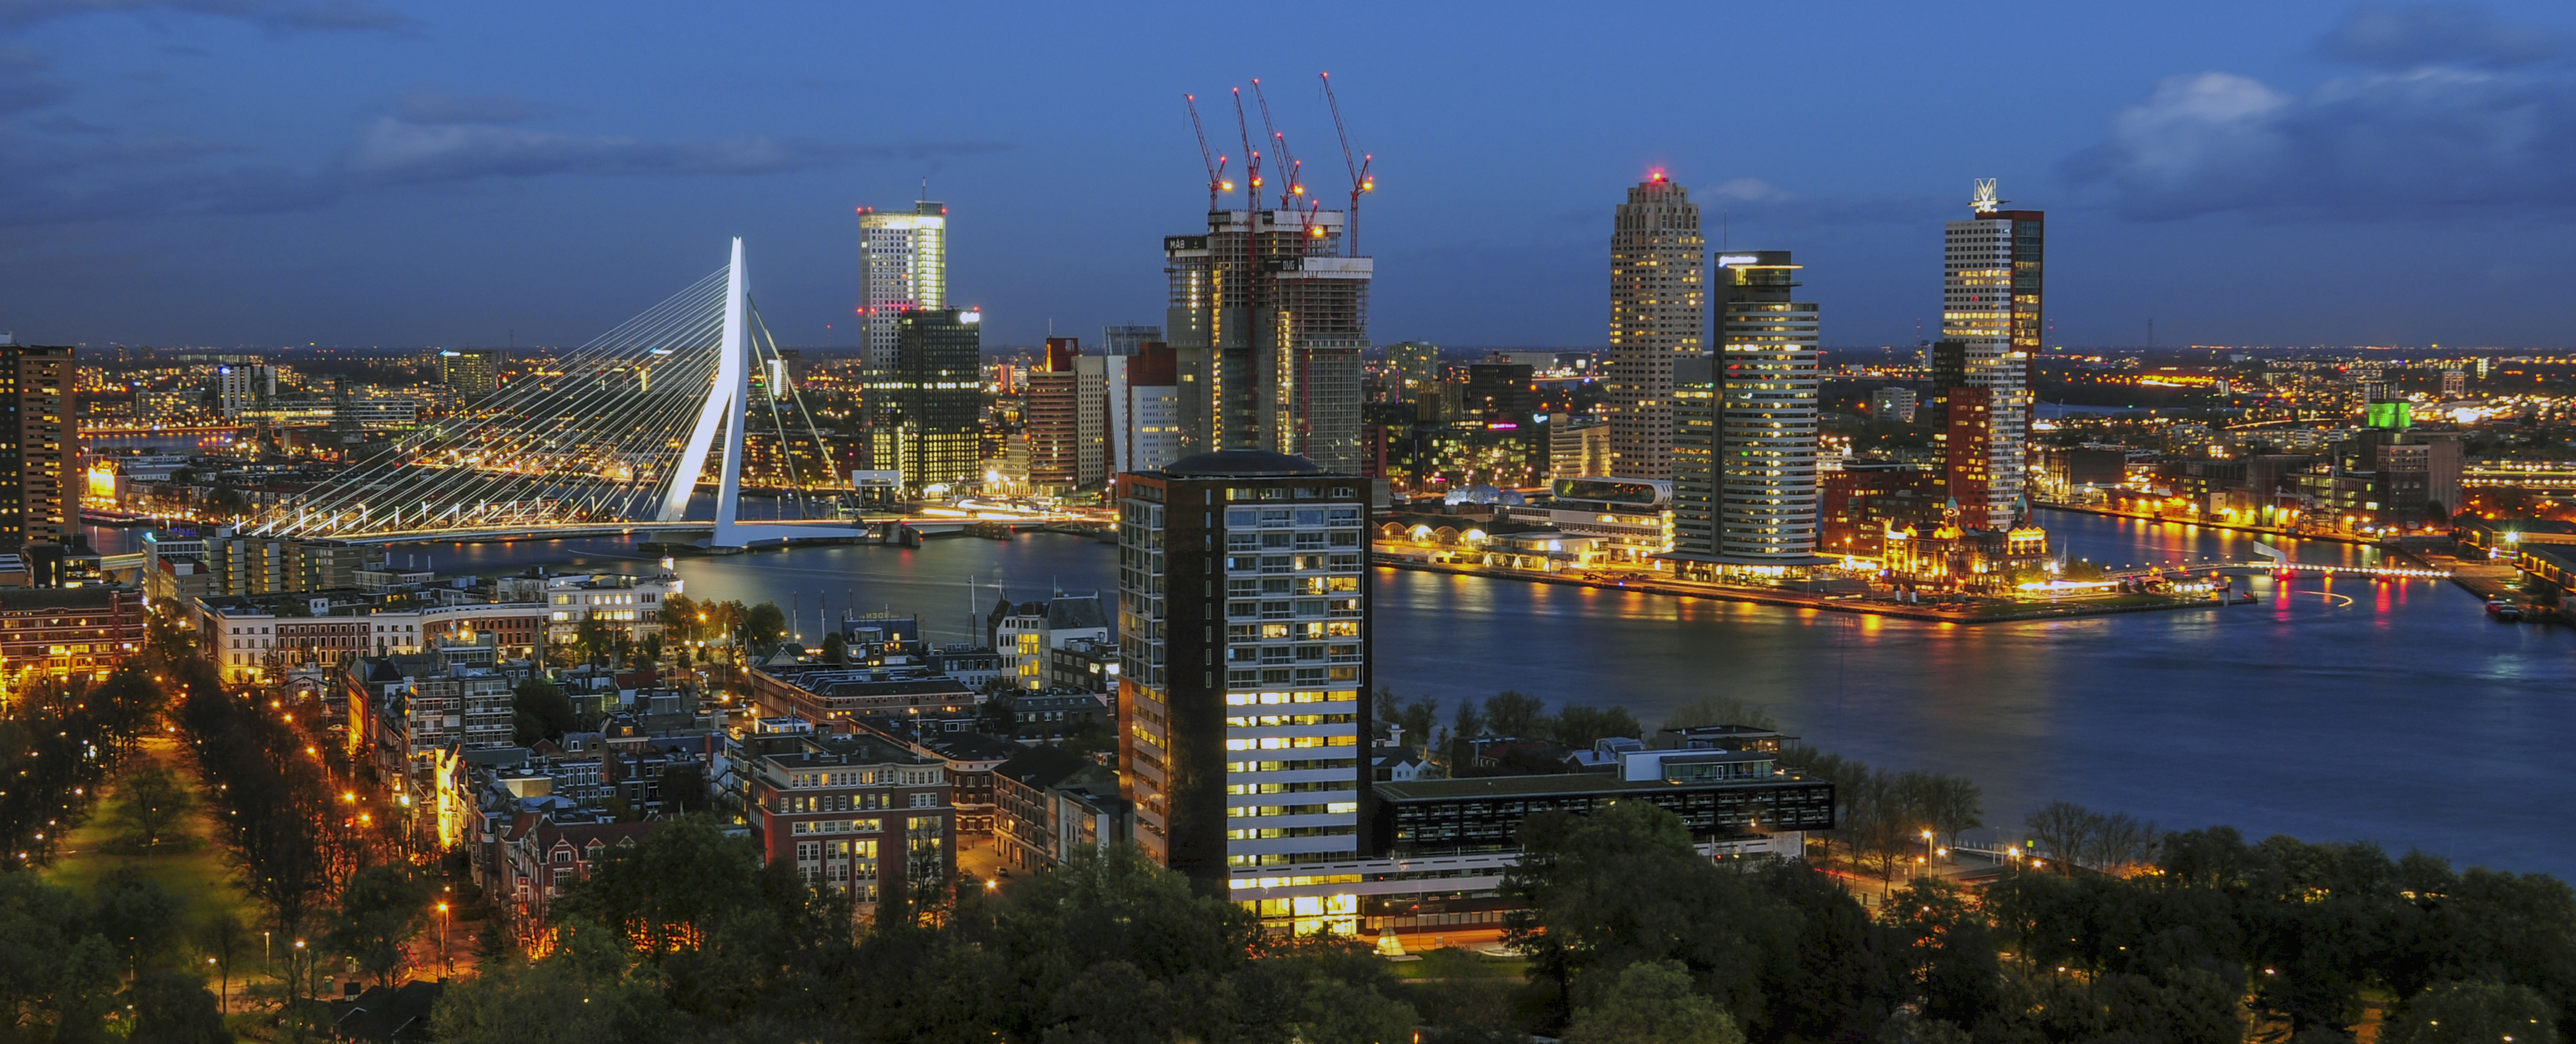
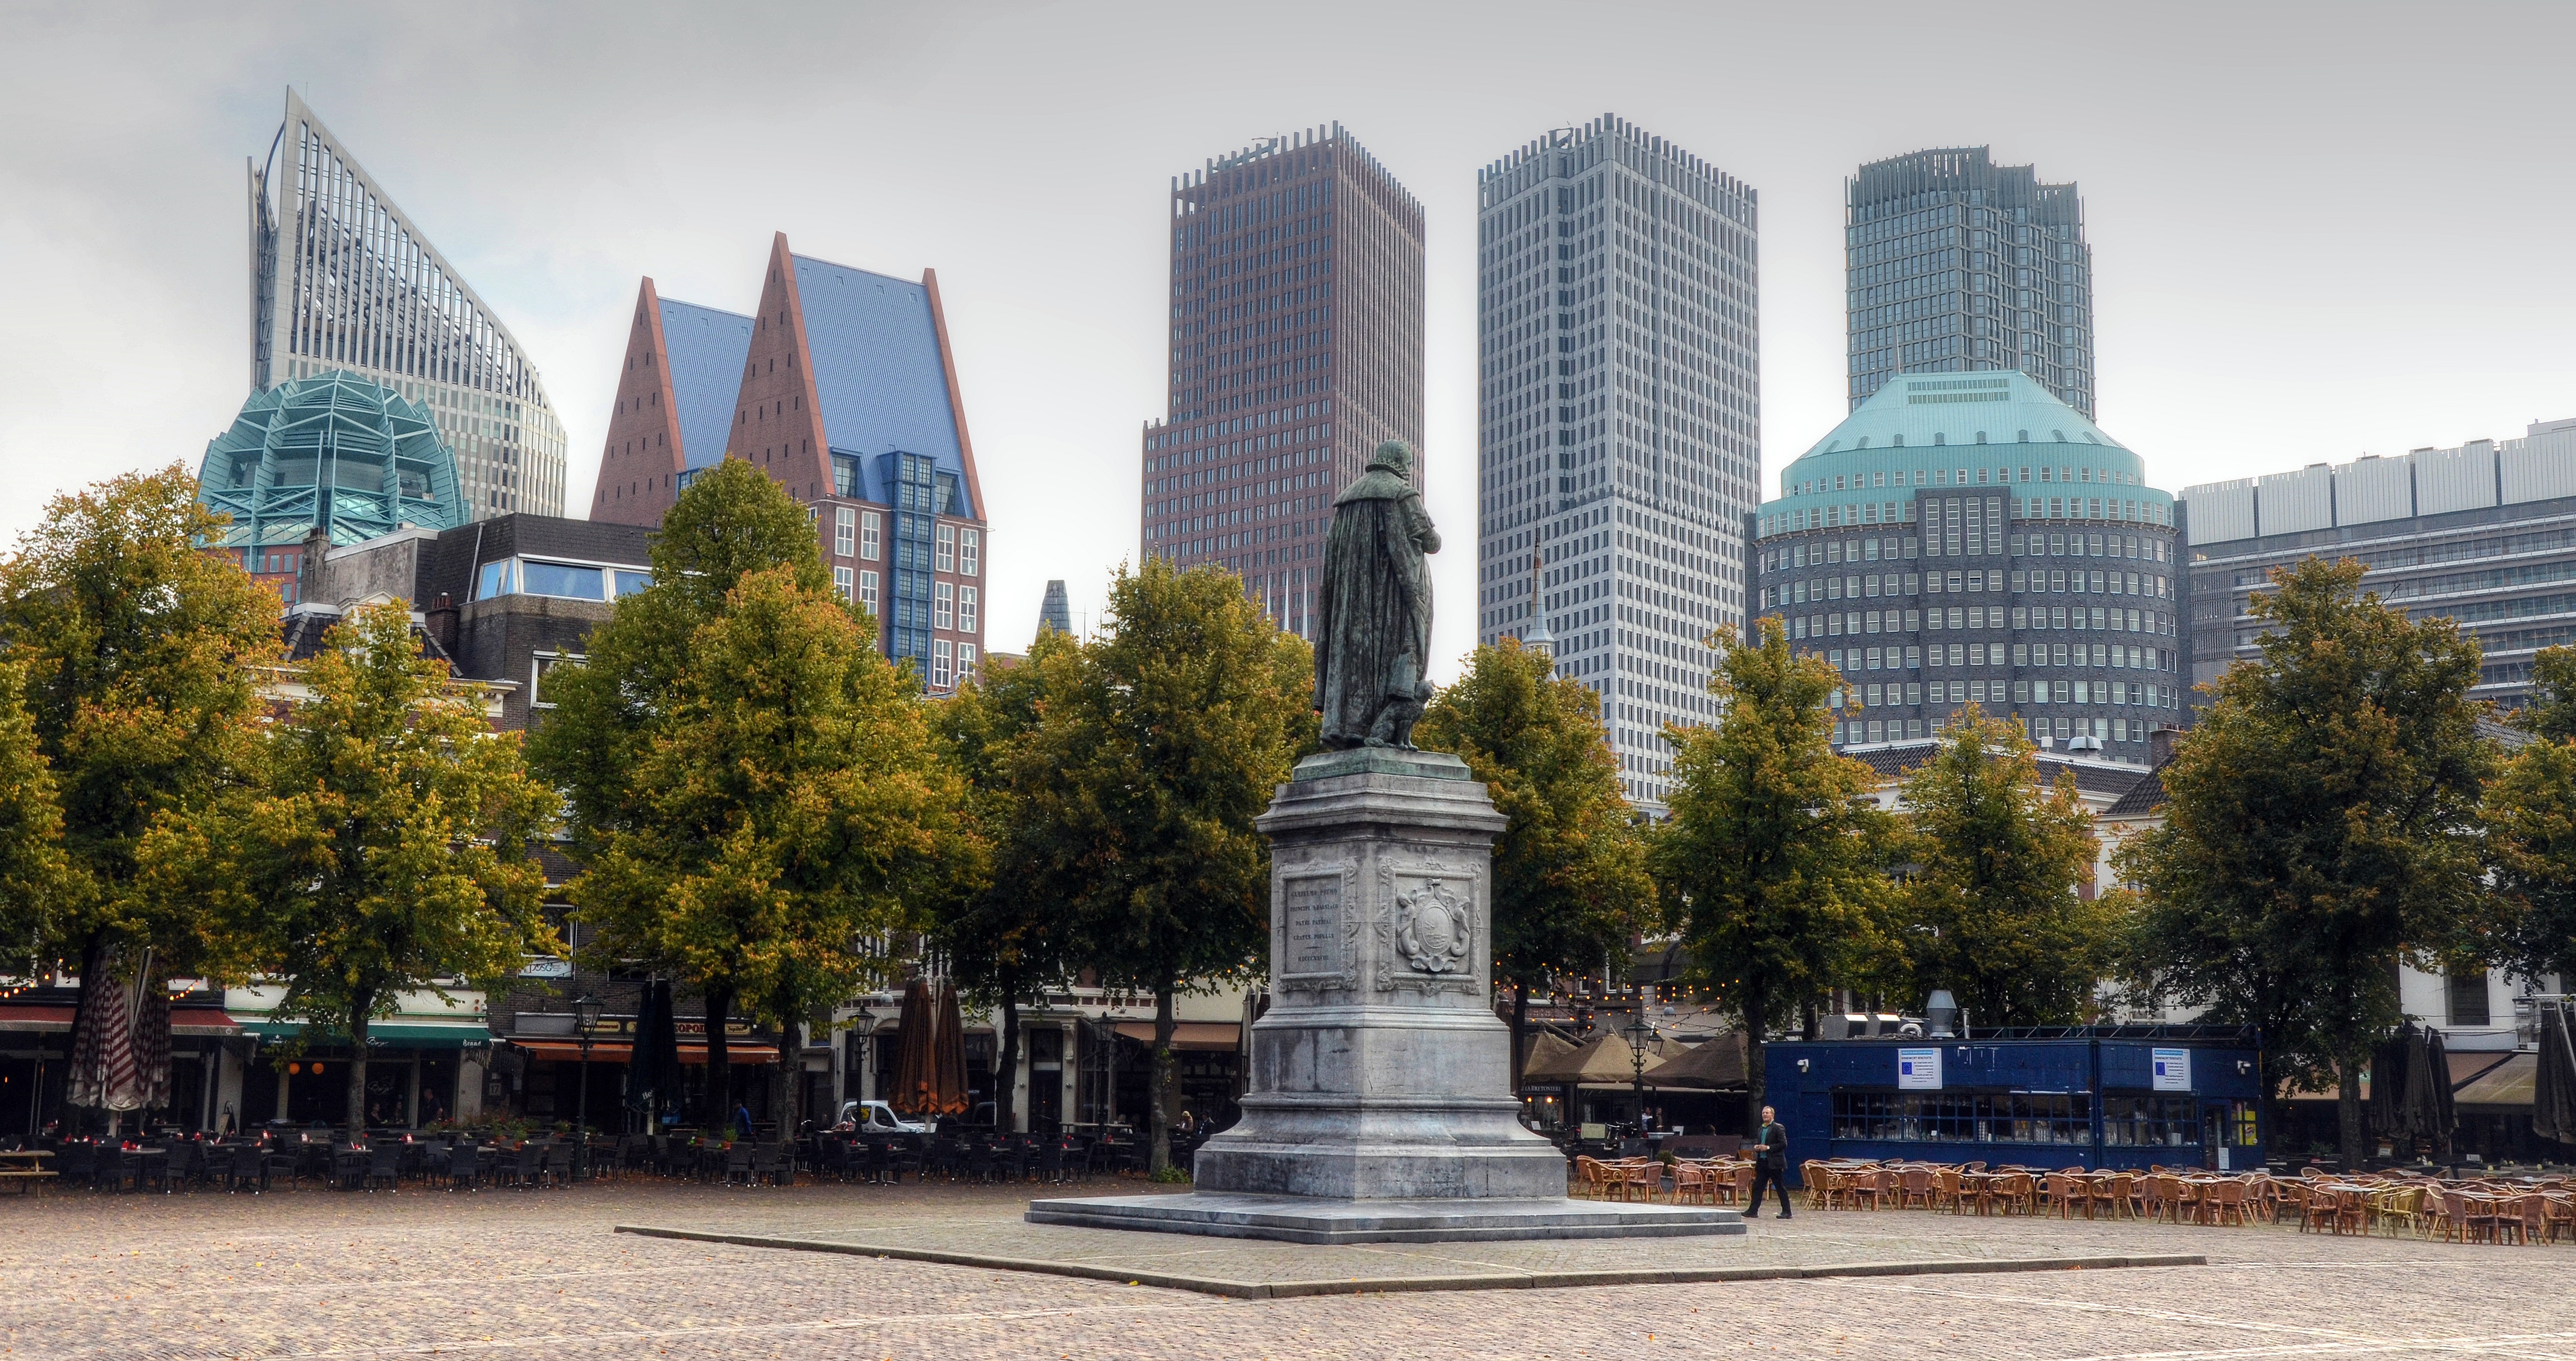
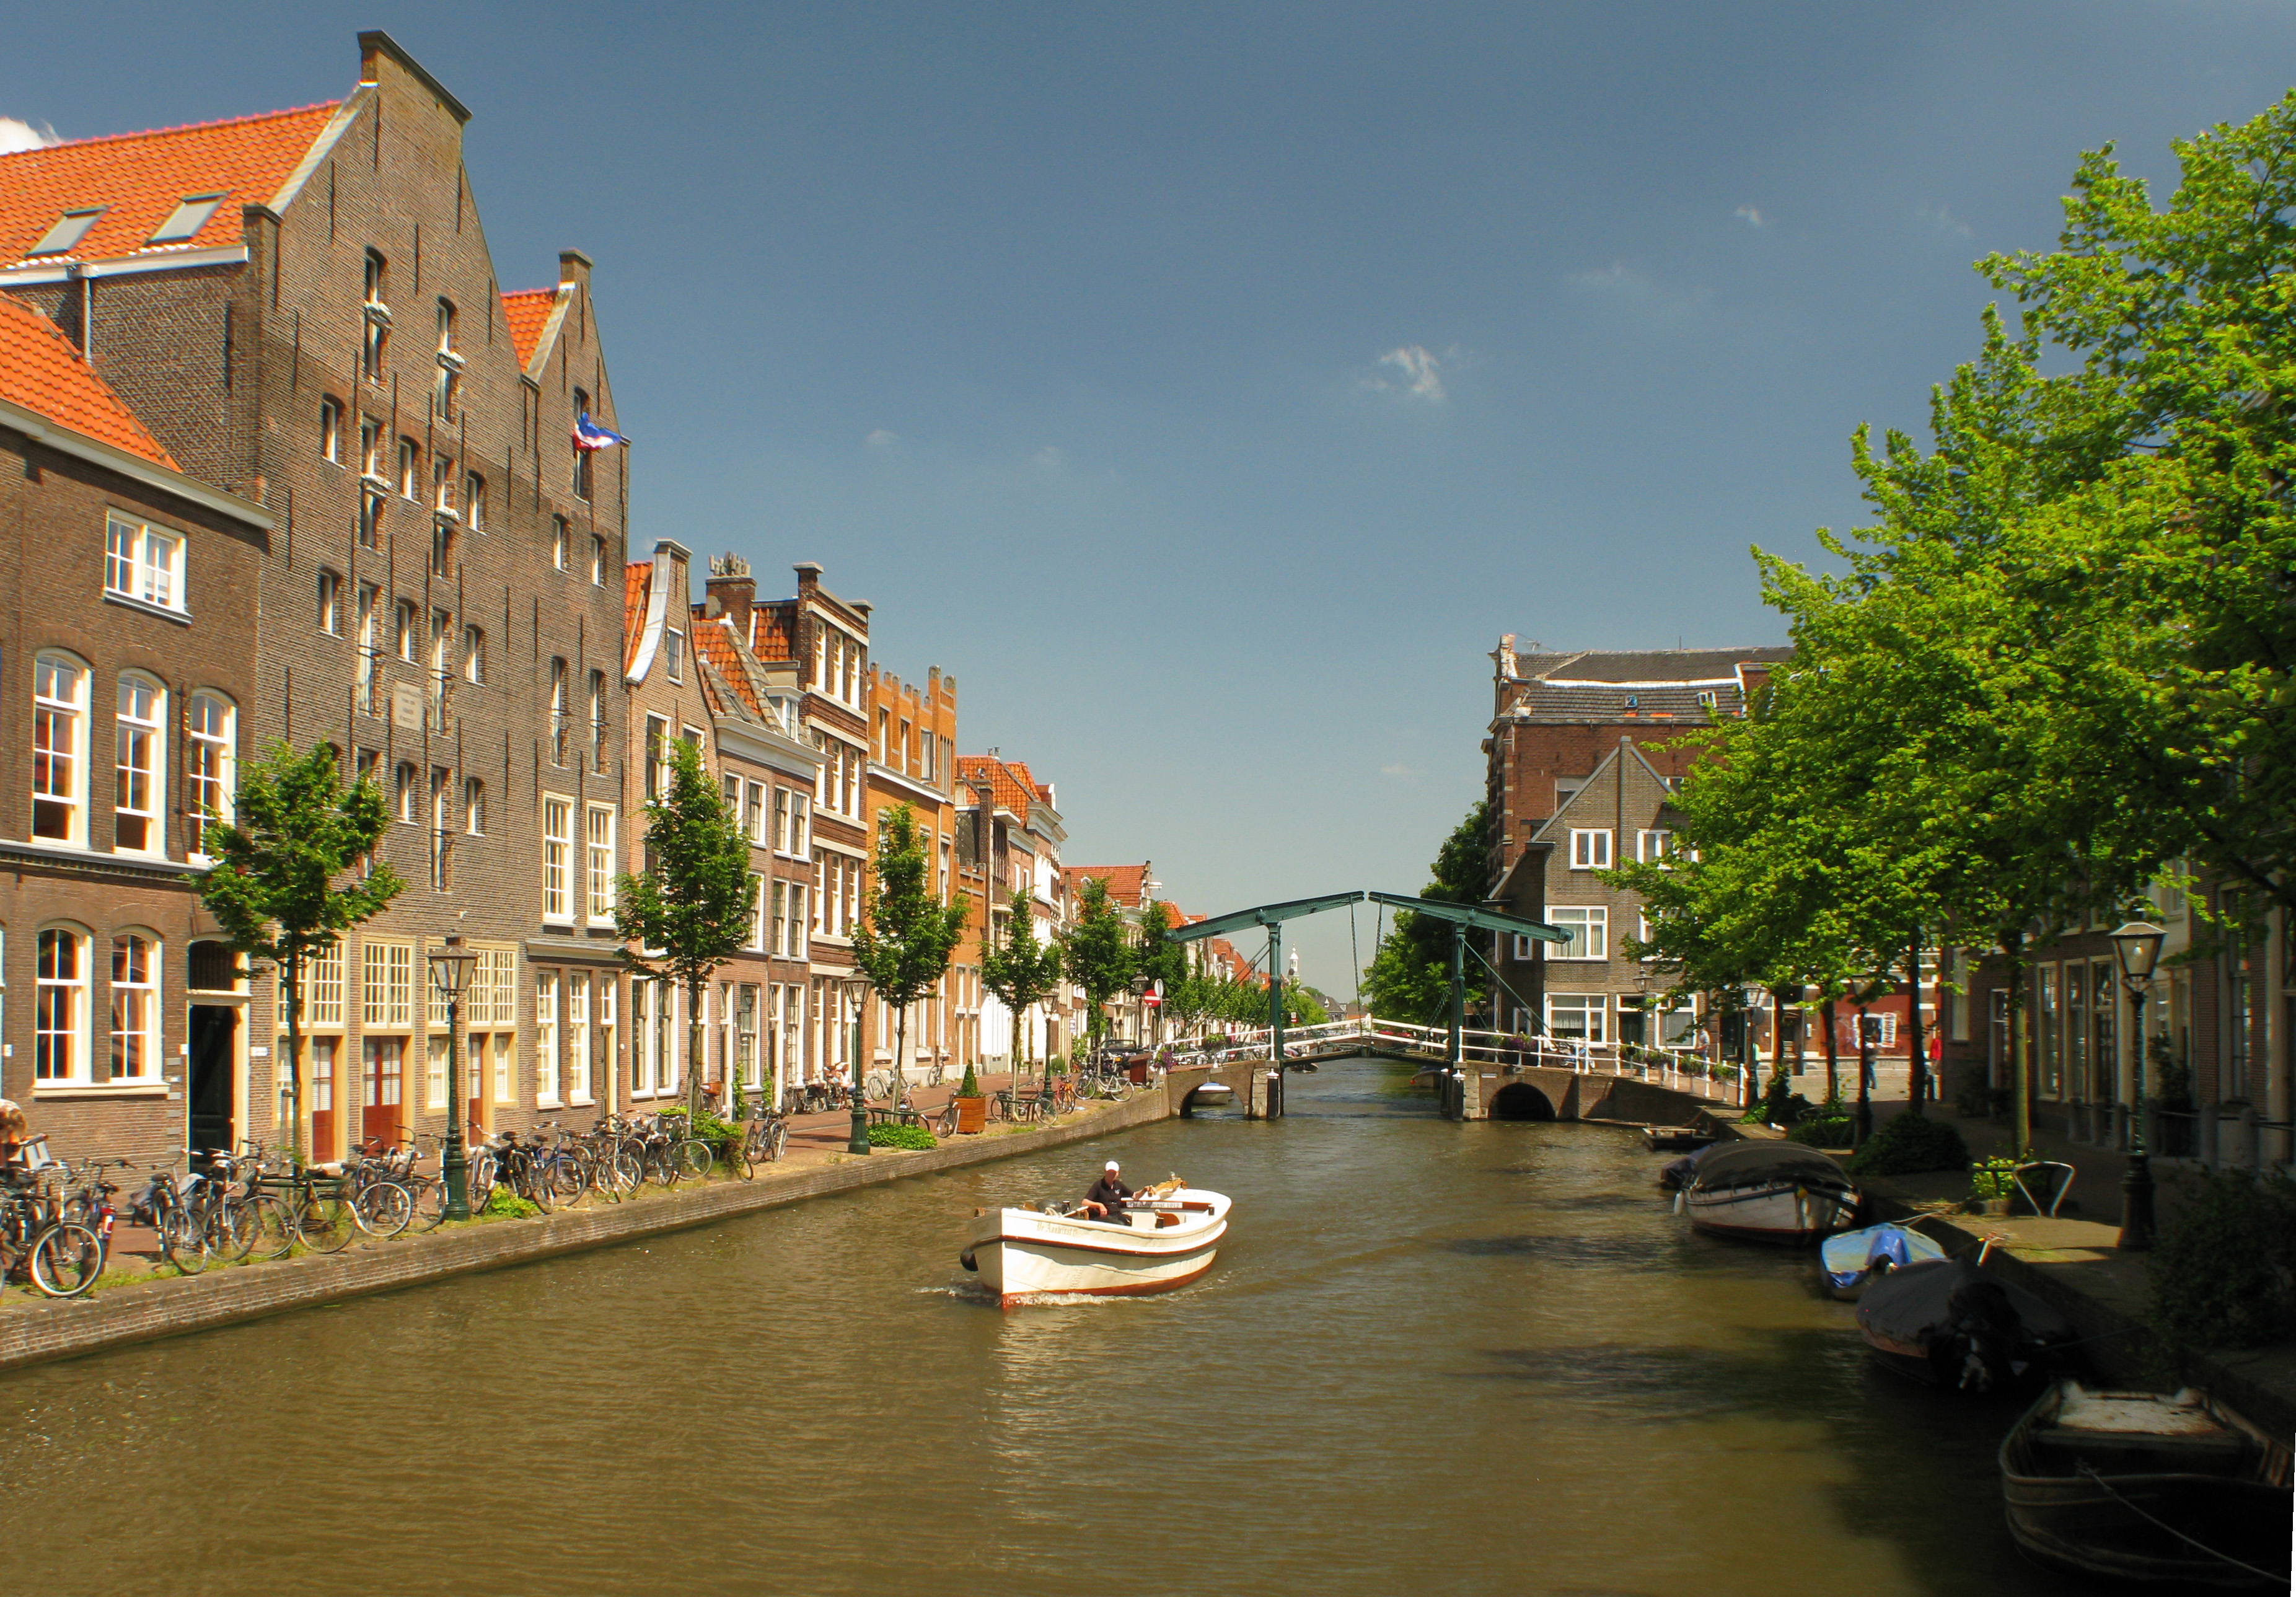
Pijnacker
Pijnacker is a town in the Dutch province of South Holland. It is located about 4 km east of the city of Delft, in the municipality of Pijnacker-Nootdorp. has two stops on the Randstadrail E-lijn between The Hague and Rotterdam: Pijnacker Centrum an..
Pijnacker Wikipedia Page
About Our Data
The data on this page is estimated using a number of publicly available tools and resources. It is provided without warranty, and could contain inaccuracies. Use at your own risk.