Categories in Flisa
Industries
Business Distribution by Industry in Flisa
| Industry Description | Number of Establishments | Average Age of Business |
|---|---|---|
| Unreachable | 95 | — |
| Buses and trains | 27 | — |
| Construction of buildings | 22 | — |
| Shopping | 18 | — |
| Car repair | 17 | 28 years |
| Health and medical | 15 | — |
| Education | 14 | — |
| Beauty salons | 13 | — |
| Restaurants | 13 | — |
| Wholesale of machinery | 11 | — |
| Clothing stores | 11 | — |
Map of Flisa
Interactive Map
Flisa Population
Years 1975 to 2020
| Data | 1975 | 1990 | 2000 | 2015 | 2020 |
|---|---|---|---|---|---|
| Population | 3,465 | 2,569 | 2,303 | 1,735 | 1,809 |
| Population Density | 1,980 / km² | 1,468 / km² | 1,316 / km² | 991.4 / km² | 1,033.7 / km² |
Flisa Population change from 2000 to 2015
Decrease of 24.7% from year 2000 to 2015
| Location | Change since 1975 | Change since 1990 | Change since 2000 |
|---|---|---|---|
| Flisa | -49.9% | -32.5% | -24.7% |
| Hedmark | -0.5% | +3.1% | +4.2% |
| Norway | +30.2% | +23.2% | +16.4% |
Flisa Population Density
Population Density: 1,034 / km²
| Location | Population | Area | Density |
|---|---|---|---|
| Flisa | 1,809 | 1.75 km² | 1,034 / km² |
| Hedmark | 196,387 | 27,409.6 km² | 7.2 / km² |
| Norway | 4.9 million | 322,754.2 km² | 15.2 / km² |
Flisa Historical and Projected Population
Estimated Population from 100 to 2100
- JRC (European Commission's Joint Research Centre) work on the GHS built-up grid
- CIESIN (Center for International Earth Science Information Network)
- [Link] Klein Goldewijk, K., Beusen, A., Doelman, J., and Stehfest, E.: Anthropogenic land use estimates for the Holocene – HYDE 3.2, Earth Syst. Sci. Data, 9, 927–953, https://doi.org/10.5194/essd-9-927-2017, 2017.
Area Codes
Percentage Area Codes used by businesses in Flisa
Human Development Index (HDI)
Statistic composite index of life expectancy, education, and per capita income.
Flisa CO2 Emissions
Carbon Dioxide (CO2) Emissions Per Capita in Tonnes Per Year
| Location | CO2 Emissions | CO2 Emissions Per Capita | CO2 Emissions Intensity |
|---|---|---|---|
| Flisa | 32,649 tn | 18.05 tn | 18,656.6 tons/km² |
| Hedmark | 3,538,521 tn | 18.02 tn | 129.1 tons/km² |
| Norway | 86,855,170 tn | 17.74 tn | 269.1 tons/km² |
| 2013 CO2 emissions (tonnes/year) | 32,649 tn |
| 2013 CO2 emissions (tonnes/year) per capita | 18.05 tn |
| 2013 CO2 emissions intensity (tonnes/km²/year) | 18,656.6 tons/km² |
Recent Nearby Earthquakes
Magnitude 3.0 and greater
| Date▼ | Time↕ | Magnitude↕ | Distance↕ | Depth↕ | Location↕ | Link |
|---|---|---|---|---|---|---|
| 4/7/04 | 8:53 AM | 3.4 | 30.6 km | 22,900 m | southern Norway | usgs.gov |
| 11/19/94 | 9:07 AM | 3.5 | 70 km | 10,000 m | southern Norway | usgs.gov |
| 11/27/93 | 6:57 PM | 3.1 | 40.2 km | 10,000 m | southern Norway | usgs.gov |
| 11/12/93 | 7:54 PM | 3.4 | 98.6 km | 10,000 m | Sweden | usgs.gov |
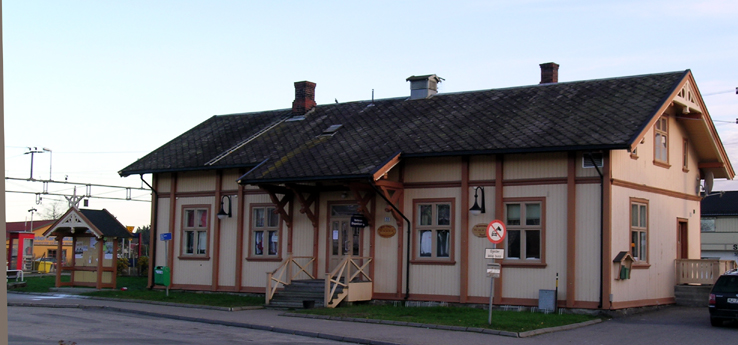
Flisa
Flisa is a small town in south-eastern Norway, and the administrative centre of Åsnes municipality. Its population as of 1 January 2012 is 1,623. some time the log driver statue was the town's only landmark. In recent years however, attractions such..
Flisa Wikipedia Page

About Our Data
The data on this page is estimated using a number of publicly available tools and resources. It is provided without warranty, and could contain inaccuracies. Use at your own risk.