Categories in Haslum
Car Repair and MaintenanceGas StationImport Export CompanyIndustrial & Construction ManufacturingWholesale GrocerClothing storesAssociation or OrganizationComputer ConsultantConstruction of buildingsContractorEngineering Consultancy OfficeHome Repair ContractorPainting and paint contractorsPlumbing installation and repairKindergartenPreschools and kindergartensArtistArts & DesignGraphic DesignerMusic RelatedPhotographerGrocery stores and supermarketsRestaurantsBeauty aidsFinancial InstitutionInvestment CompanyGeneral practitionersHair SalonAdvertising ServiceBack OfficeBusiness Management ConsultantBusiness to Business ServiceConsulting & Advisory ServicesMedia AgencyServices for IndustryReal Estate AgencyReal Estate AgentsResidential Property RentalsGeneral & Multi-Sport VenuesPlaygroundSports clubsElectric Vehicle Charging StationFreight/commercial transportTransportation logistics
Industries
Business Distribution by Industry in Haslum
| Industry Description | Number of Establishments |
|---|---|
| Electronics stores | 35 |
| Corporate management | 30 |
| Education | 20 |
| Construction of buildings | 18 |
| Advertising and marketing | 15 |
| Legal and financial | 15 |
| Health and medical | 14 |
| Wholesale of machinery | 13 |
| Shopping | 12 |
| Hospitals | 12 |
| Beauty salons | 11 |
| General cleaning services | 10 |
Haslum Facts
| Area | 0.2 km² |
| Population | 7 |
| Population change (1975 to 2020) | +133.3% |
| Population change (2000 to 2020) | +0.0% |
| Neighborhoods | Alna, Haslum, Sagene, Frogner, Gamle Oslo |
| Local Time | |
| Timezone | Central European Summer Time |
| Lat & Lng | 58.80662, 9.37811 |
Map of Haslum
Interactive Map
Haslum Population
Years 1975 to 2020
| Data | 1975 | 1990 | 2000 | 2015 | 2020 |
|---|---|---|---|---|---|
| Population | 3 | 2 | 7 | 7 | 7 |
| Population Density | 16 / km² | 10.7 / km² | 37.3 / km² | 37.3 / km² | 37.3 / km² |
Sources: JRC (European Commission's Joint Research Centre) work on the GHS built-up grid
Haslum Population change from 2000 to 2015
Increase of 0% from year 2000 to 2015
| Location | Change since 1975 | Change since 1990 | Change since 2000 |
|---|---|---|---|
| Haslum | +133.3% | +250% | +0% |
| Telemark | +1.1% | +3.9% | +4.5% |
| Norway | +30.2% | +23.2% | +16.4% |
Sources: JRC (European Commission's Joint Research Centre) work on the GHS built-up grid
Haslum Population Density
Population Density: 37.3 / km²
| Location | Population | Area | Density |
|---|---|---|---|
| Haslum | 7 | 0.188 km² | 37.3 / km² |
| Telemark | 173,753 | 16,157.8 km² | 10.8 / km² |
| Norway | 4.9 million | 322,754.2 km² | 15.2 / km² |
Sources: JRC (European Commission's Joint Research Centre) work on the GHS built-up grid
Haslum Historical and Projected Population
Estimated Population from 0 to 2100
Sources:
- JRC (European Commission's Joint Research Centre) work on the GHS built-up grid
- CIESIN (Center for International Earth Science Information Network)
- [Link] Klein Goldewijk, K., Beusen, A., Doelman, J., and Stehfest, E.: Anthropogenic land use estimates for the Holocene – HYDE 3.2, Earth Syst. Sci. Data, 9, 927–953, https://doi.org/10.5194/essd-9-927-2017, 2017.
Area Codes
Percentage Area Codes used by businesses in Haslum
Human Development Index (HDI)
Statistic composite index of life expectancy, education, and per capita income.
Source: [Link] Kummu, M., Taka, M. &Guillaume, J. Gridded global datasets for Gross Domestic Product and Human Development Index over 1990–2015. Sci Data 5, 180004 (2018) doi:10.1038/sdata.2018.4
Haslum CO2 Emissions
Carbon Dioxide (CO2) Emissions Per Capita in Tonnes Per Year
| Location | CO2 Emissions | CO2 Emissions Per Capita | CO2 Emissions Intensity |
|---|---|---|---|
| Haslum | 96 tn | 13.77 tn | 513.9 tons/km² |
| Telemark | 3,018,619 tn | 17.37 tn | 186.8 tons/km² |
| Norway | 86,855,170 tn | 17.74 tn | 269.1 tons/km² |
Sources: [Link] Moran, D., Kanemoto K; Jiborn, M., Wood, R., Többen, J., and Seto, K.C. (2018) Carbon footprints of 13,000 cities. Environmental Research Letters DOI: 10.1088/1748-9326/aac72a
Haslum CO2 Emissions
| 2013 CO2 emissions (tonnes/year) | 96 tn |
| 2013 CO2 emissions (tonnes/year) per capita | 13.77 tn |
| 2013 CO2 emissions intensity (tonnes/km²/year) | 513.9 tons/km² |
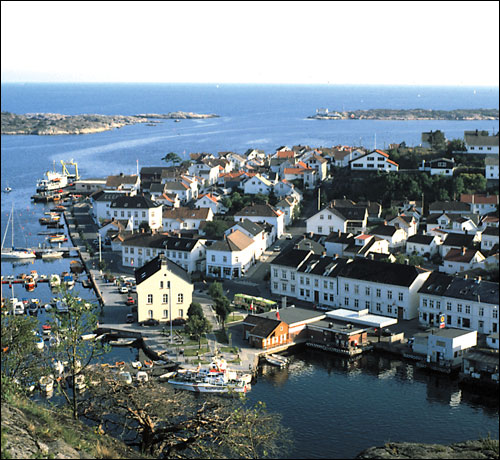
Haslum
Haslum is a district in the municipality of Bærum, Norway. Its population (2007) is 6,041. Haslum is noted for its medieval parish church, which is surrounded by a cemetery.
Haslum Wikipedia Page
About Our Data
The data on this page is estimated using a number of publicly available tools and resources. It is provided without warranty, and could contain inaccuracies. Use at your own risk.