Categories in Hasvik
Industries
Business Distribution by Industry in Hasvik
| Industry Description | Number of Establishments |
|---|---|
| Construction of buildings | 10 |
Hasvik Facts
| Area | 1.6 km² |
| Population | 76 |
| Population change (1975 to 2020) | -84.4% |
| Population change (2000 to 2020) | -44.5% |
| Local Time | |
| Timezone | Central European Summer Time |
| Lat & Lng | 70.48641, 22.16110 |
| Postal Codes | 9590 |
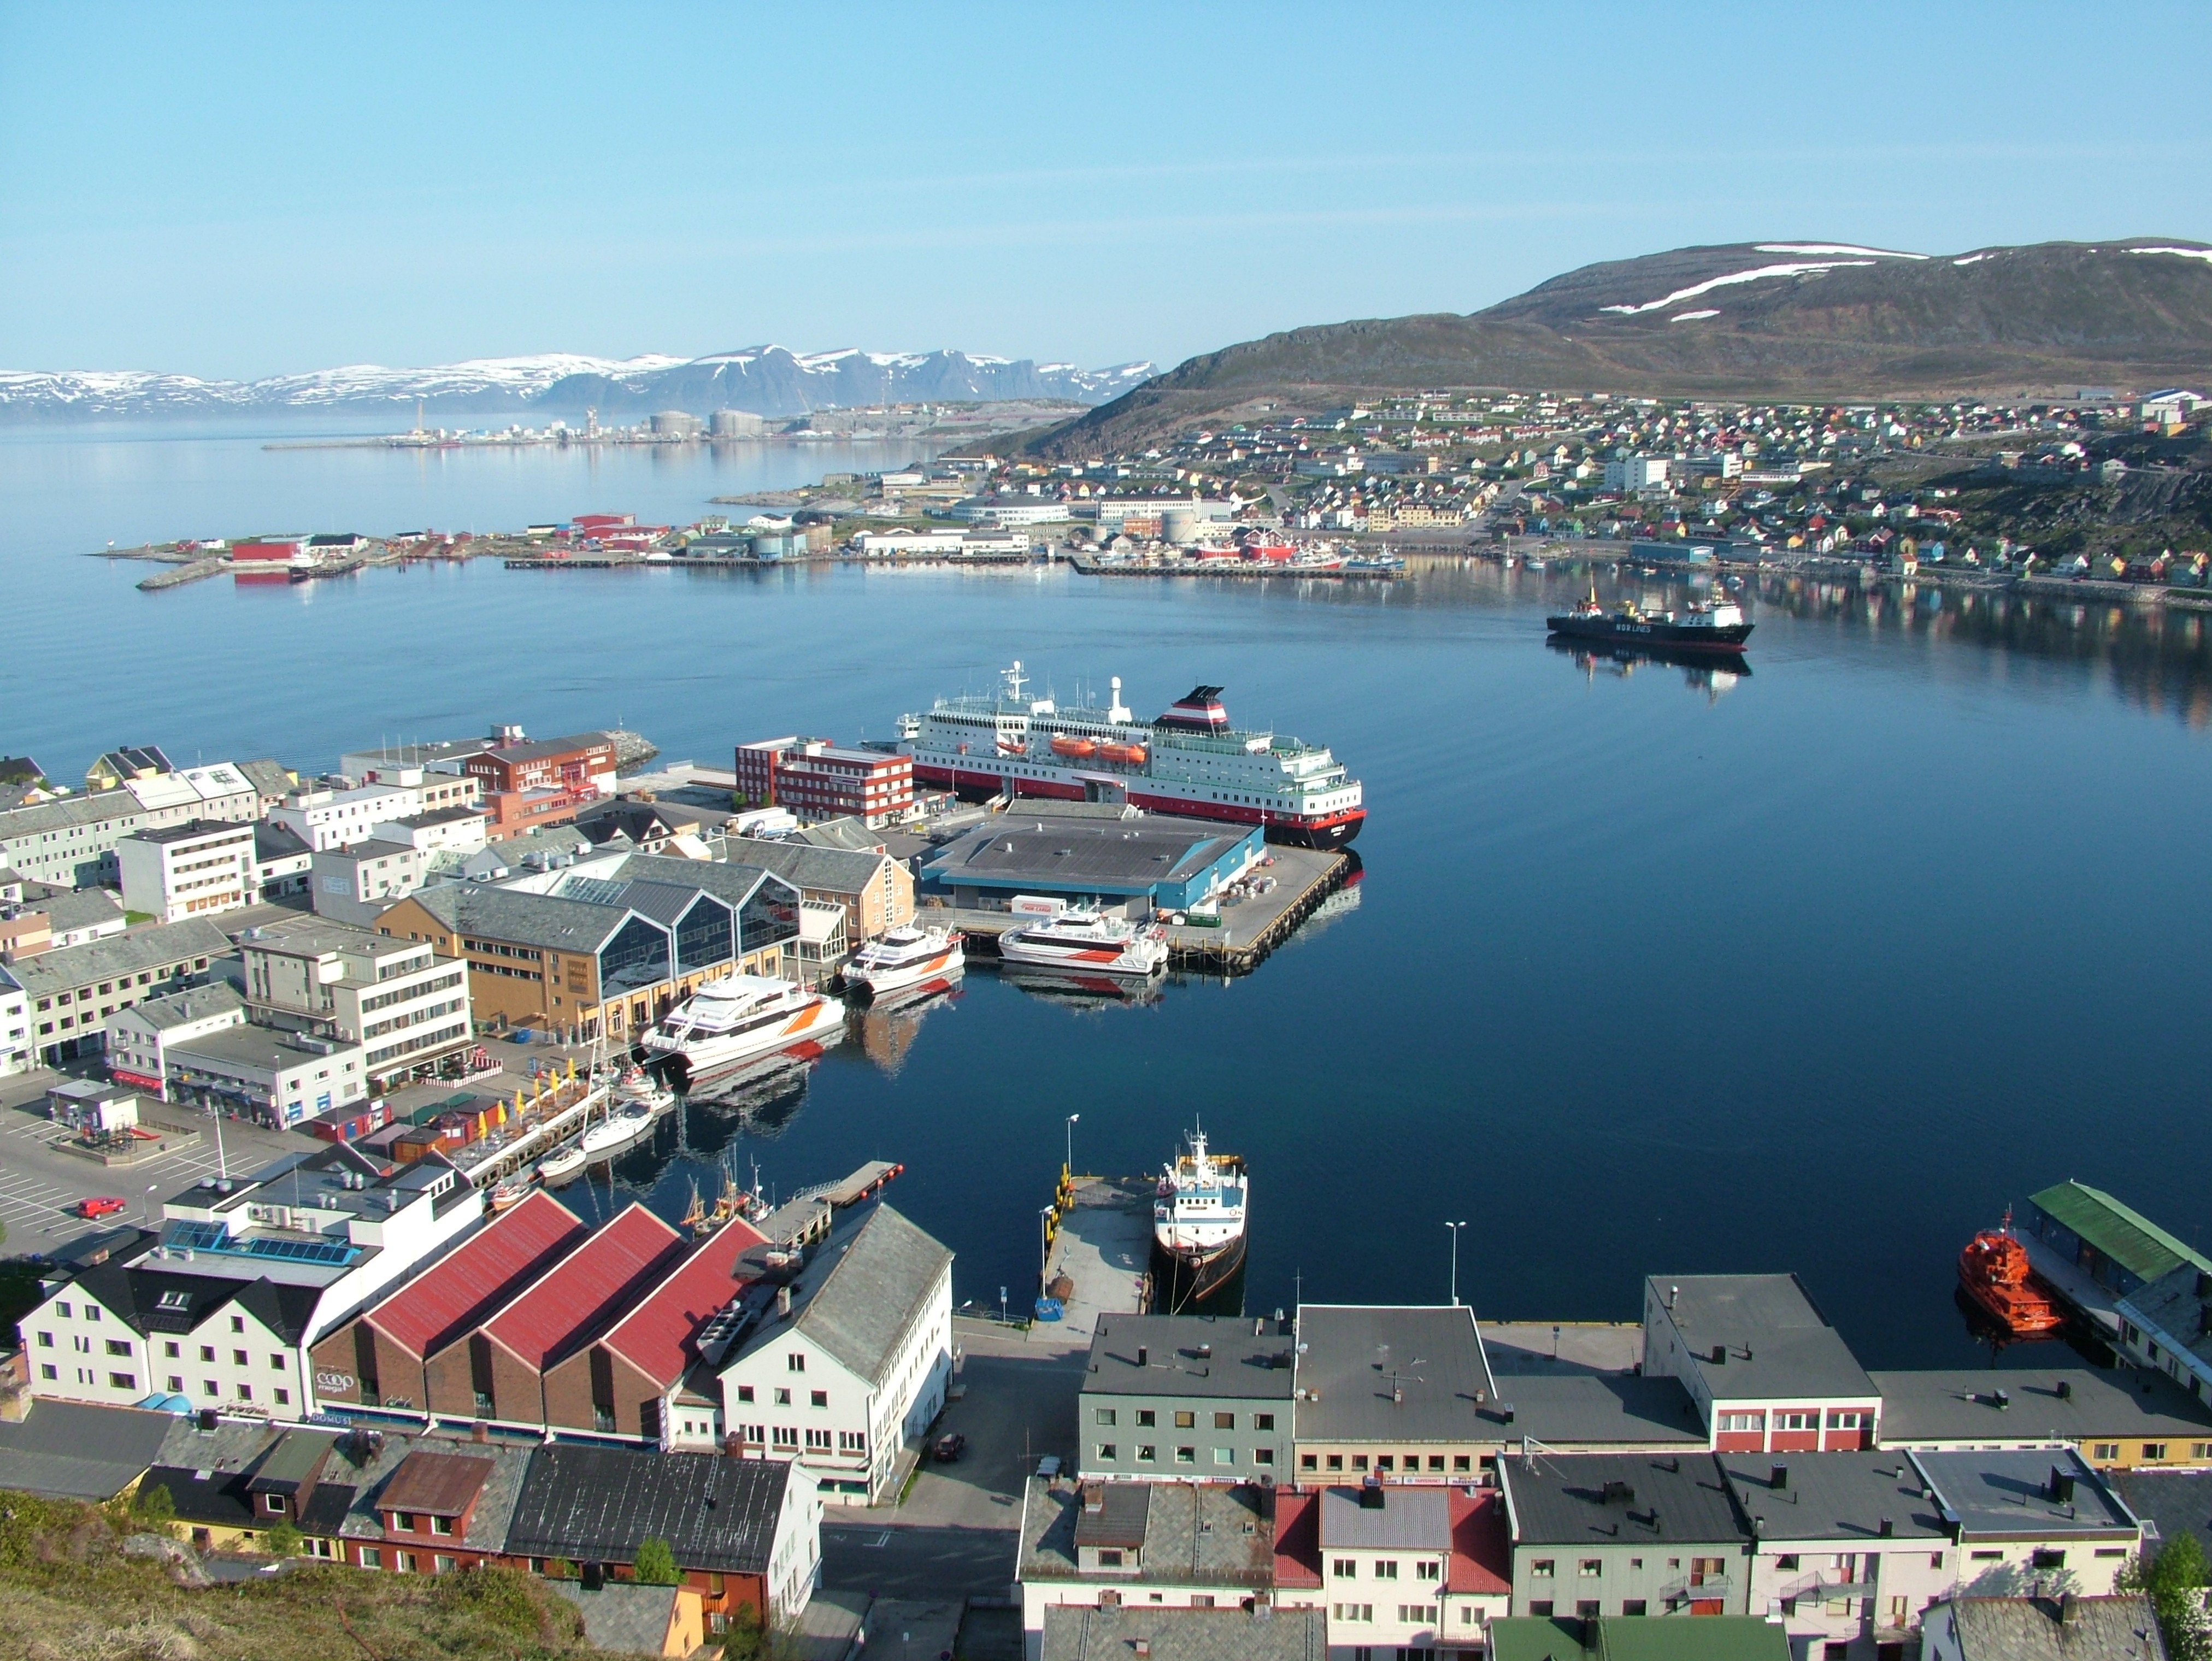
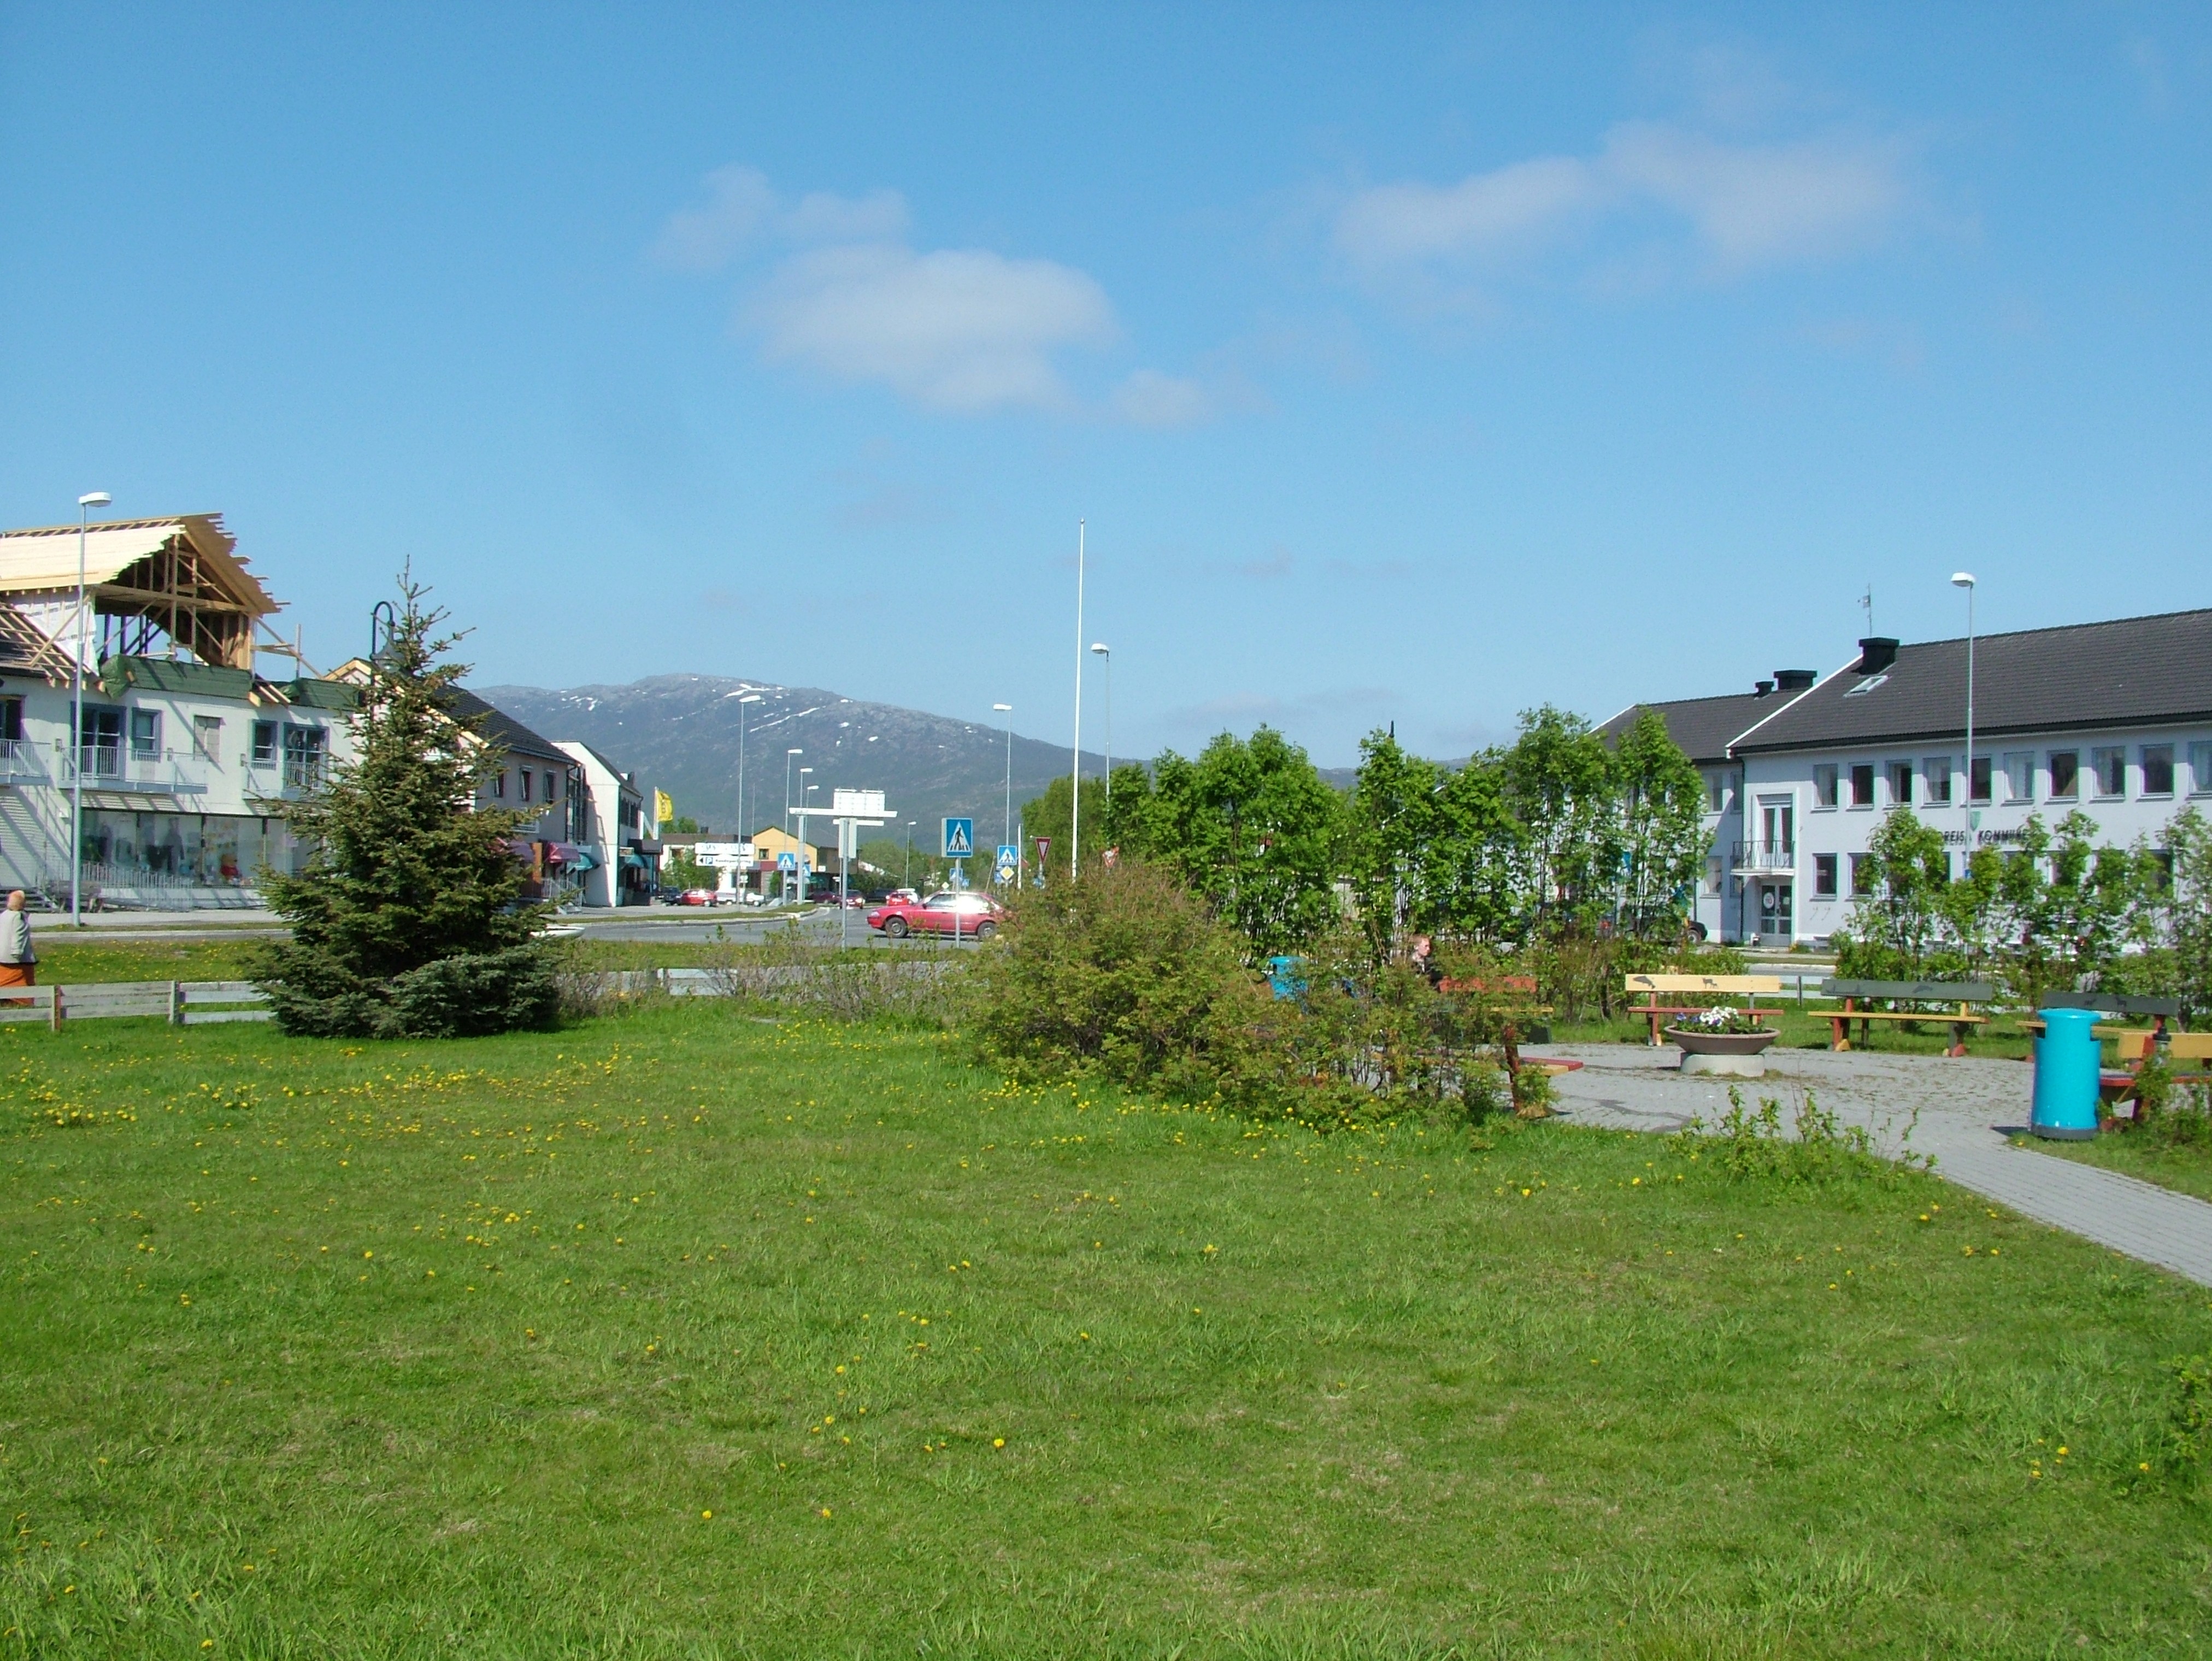
Map of Hasvik
Interactive Map
Hasvik Population
Years 1975 to 2020
| Data | 1975 | 1990 | 2000 | 2015 | 2020 |
|---|---|---|---|---|---|
| Population | 488 | 234 | 137 | 76 | 76 |
| Population Density | 312.3 / km² | 149.8 / km² | 87.7 / km² | 48.6 / km² | 48.6 / km² |
Sources: JRC (European Commission's Joint Research Centre) work on the GHS built-up grid
Hasvik Population change from 2000 to 2015
Decrease of 44.5% from year 2000 to 2015
| Location | Change since 1975 | Change since 1990 | Change since 2000 |
|---|---|---|---|
| Hasvik | -84.4% | -67.5% | -44.5% |
| Finnmark | -14.8% | -4.8% | -0.1% |
| Norway | +30.2% | +23.2% | +16.4% |
Sources: JRC (European Commission's Joint Research Centre) work on the GHS built-up grid
Hasvik Population Density
Population Density: 48.6 / km²
| Location | Population | Area | Density |
|---|---|---|---|
| Hasvik | 76 | 1.563 km² | 48.6 / km² |
| Finnmark | 75,051 | 74,273.1 km² | 1 / km² |
| Norway | 4.9 million | 322,754.2 km² | 15.2 / km² |
Sources: JRC (European Commission's Joint Research Centre) work on the GHS built-up grid
Hasvik Historical and Projected Population
Estimated Population from 1975 to 2100
Sources:
- JRC (European Commission's Joint Research Centre) work on the GHS built-up grid
- CIESIN (Center for International Earth Science Information Network)
- [Link] Klein Goldewijk, K., Beusen, A., Doelman, J., and Stehfest, E.: Anthropogenic land use estimates for the Holocene – HYDE 3.2, Earth Syst. Sci. Data, 9, 927–953, https://doi.org/10.5194/essd-9-927-2017, 2017.
Area Codes
Percentage Area Codes used by businesses in Hasvik
Human Development Index (HDI)
Statistic composite index of life expectancy, education, and per capita income.
Source: [Link] Kummu, M., Taka, M. &Guillaume, J. Gridded global datasets for Gross Domestic Product and Human Development Index over 1990–2015. Sci Data 5, 180004 (2018) doi:10.1038/sdata.2018.4
Hasvik CO2 Emissions
Carbon Dioxide (CO2) Emissions Per Capita in Tonnes Per Year
| Location | CO2 Emissions | CO2 Emissions Per Capita | CO2 Emissions Intensity |
|---|---|---|---|
| Hasvik | 996 tn | 13.11 tn | 637.7 tons/km² |
| Finnmark | 888,612 tn | 11.84 tn | 12 tons/km² |
| Norway | 86,855,170 tn | 17.74 tn | 269.1 tons/km² |
Sources: [Link] Moran, D., Kanemoto K; Jiborn, M., Wood, R., Többen, J., and Seto, K.C. (2018) Carbon footprints of 13,000 cities. Environmental Research Letters DOI: 10.1088/1748-9326/aac72a
Hasvik CO2 Emissions
| 2013 CO2 emissions (tonnes/year) | 996 tn |
| 2013 CO2 emissions (tonnes/year) per capita | 13.11 tn |
| 2013 CO2 emissions intensity (tonnes/km²/year) | 637.7 tons/km² |

About Our Data
The data on this page is estimated using a number of publicly available tools and resources. It is provided without warranty, and could contain inaccuracies. Use at your own risk.