Categories in Hellandsbygd
Hellandsbygd Facts
| Area | 0.1 km² |
| Local Time | |
| Timezone | Central European Summer Time |
| Lat & Lng | 59.69050, 6.51133 |
Map of Hellandsbygd
Interactive Map
Hellandsbygd Population
Years 1975 to 2015
| Data | 1975 | 1990 | 2000 | 2015 |
|---|---|---|---|---|
| Population | 0 | 0 | 0 | 0 |
| Population Density | 0 / km² | 0 / km² | 0 / km² | 0 / km² |
Hellandsbygd Population change from 2000 to 2000
| Location | Change since 1975 | Change since 1990 |
|---|---|---|
| Hellandsbygd | — | — |
| Rogaland | +31.3% | +12.7% |
| Norway | +11.9% | +5.8% |
Rogaland Population Density
Population Density: 28.6 / km²
| Location | Population | Area | Density |
|---|---|---|---|
| Rogaland | 472,447 | 16,531.3 km² | 28.6 / km² |
| Norway | 4.9 million | 322,754.2 km² | 15.2 / km² |
Hellandsbygd Historical and Projected Population
Estimated Population from 1975 to 2015
- JRC (European Commission's Joint Research Centre) work on the GHS built-up grid
- CIESIN (Center for International Earth Science Information Network)
- [Link] Klein Goldewijk, K., Beusen, A., Doelman, J., and Stehfest, E.: Anthropogenic land use estimates for the Holocene – HYDE 3.2, Earth Syst. Sci. Data, 9, 927–953, https://doi.org/10.5194/essd-9-927-2017, 2017.
Area Codes
Percentage Area Codes used by businesses in Hellandsbygd
Human Development Index (HDI)
Statistic composite index of life expectancy, education, and per capita income.
Rogaland CO2 Emissions
Carbon Dioxide (CO2) Emissions Per Capita in Tonnes Per Year
| Location | CO2 Emissions | CO2 Emissions Per Capita | CO2 Emissions Intensity |
|---|---|---|---|
| Rogaland | 5,201,816 tn | 11.01 tn | 314.7 tons/km² |
| Norway | 86,855,170 tn | 17.74 tn | 269.1 tons/km² |
| 2013 CO2 emissions (tonnes/year) | 5,201,816 tn |
| 2013 CO2 emissions (tonnes/year) per capita | 11.01 tn |
| 2013 CO2 emissions intensity (tonnes/km²/year) | 314.7 tons/km² |
Natural Hazards Risk
Relative risk out of 10
| Hazard | Risk Level |
|---|---|
| Earthquake | Low (2) |
* Risk, particularly concerning flood or landslide, may not be for the entire area.
- Dilley, M., R.S. Chen, U. Deichmann, A.L. Lerner-Lam, M. Arnold, J. Agwe, P. Buys, O. Kjekstad, B. Lyon, and G. Yetman. 2005. Natural Disaster Hotspots: A Global Risk Analysis. Washington, D.C.: World Bank. https://doi.org/10.1596/0-8213-5930-4.
- Center for Hazards and Risk Research - CHRR - Columbia University, Center for International Earth Science Information Network - CIESIN - Columbia University. 2005. Global Earthquake Hazard Distribution - Peak Ground Acceleration. Palisades, NY: NASA Socioeconomic Data and Applications Center (SEDAC). https://doi.org/10.7927/H4BZ63ZS.
Recent Nearby Earthquakes
Magnitude 3.0 and greater
| Date▼ | Time↕ | Magnitude↕ | Distance↕ | Depth↕ | Location↕ | Link |
|---|---|---|---|---|---|---|
| 3/14/12 | 7:22 PM | 3.6 | 54.2 km | 6,200 m | southern Norway | usgs.gov |
| 6/29/04 | 1:25 AM | 3.1 | 67.1 km | 8,000 m | southern Norway | usgs.gov |
| 8/12/00 | 2:27 PM | 4.1 | 83.4 km | 10,000 m | southern Norway | usgs.gov |
| 8/6/92 | 7:32 AM | 3.7 | 28.1 km | 33,000 m | southern Norway | usgs.gov |
| 4/14/92 | 1:10 PM | 3.7 | 48 km | 10,000 m | southern Norway | usgs.gov |
| 10/28/91 | 1:14 PM | 3 | 37.5 km | 10,000 m | southern Norway | usgs.gov |
| 8/23/91 | 4:07 AM | 3.1 | 87.1 km | 10,000 m | southern Norway | usgs.gov |
| 6/14/90 | 10:00 AM | 3.7 | 94.4 km | 10,000 m | southern Norway | usgs.gov |
| 2/25/90 | 10:00 AM | 3 | 15.1 km | 10,000 m | southern Norway | usgs.gov |
| 1/29/89 | 4:38 PM | 4.8 | 42.3 km | 10,000 m | southern Norway | usgs.gov |
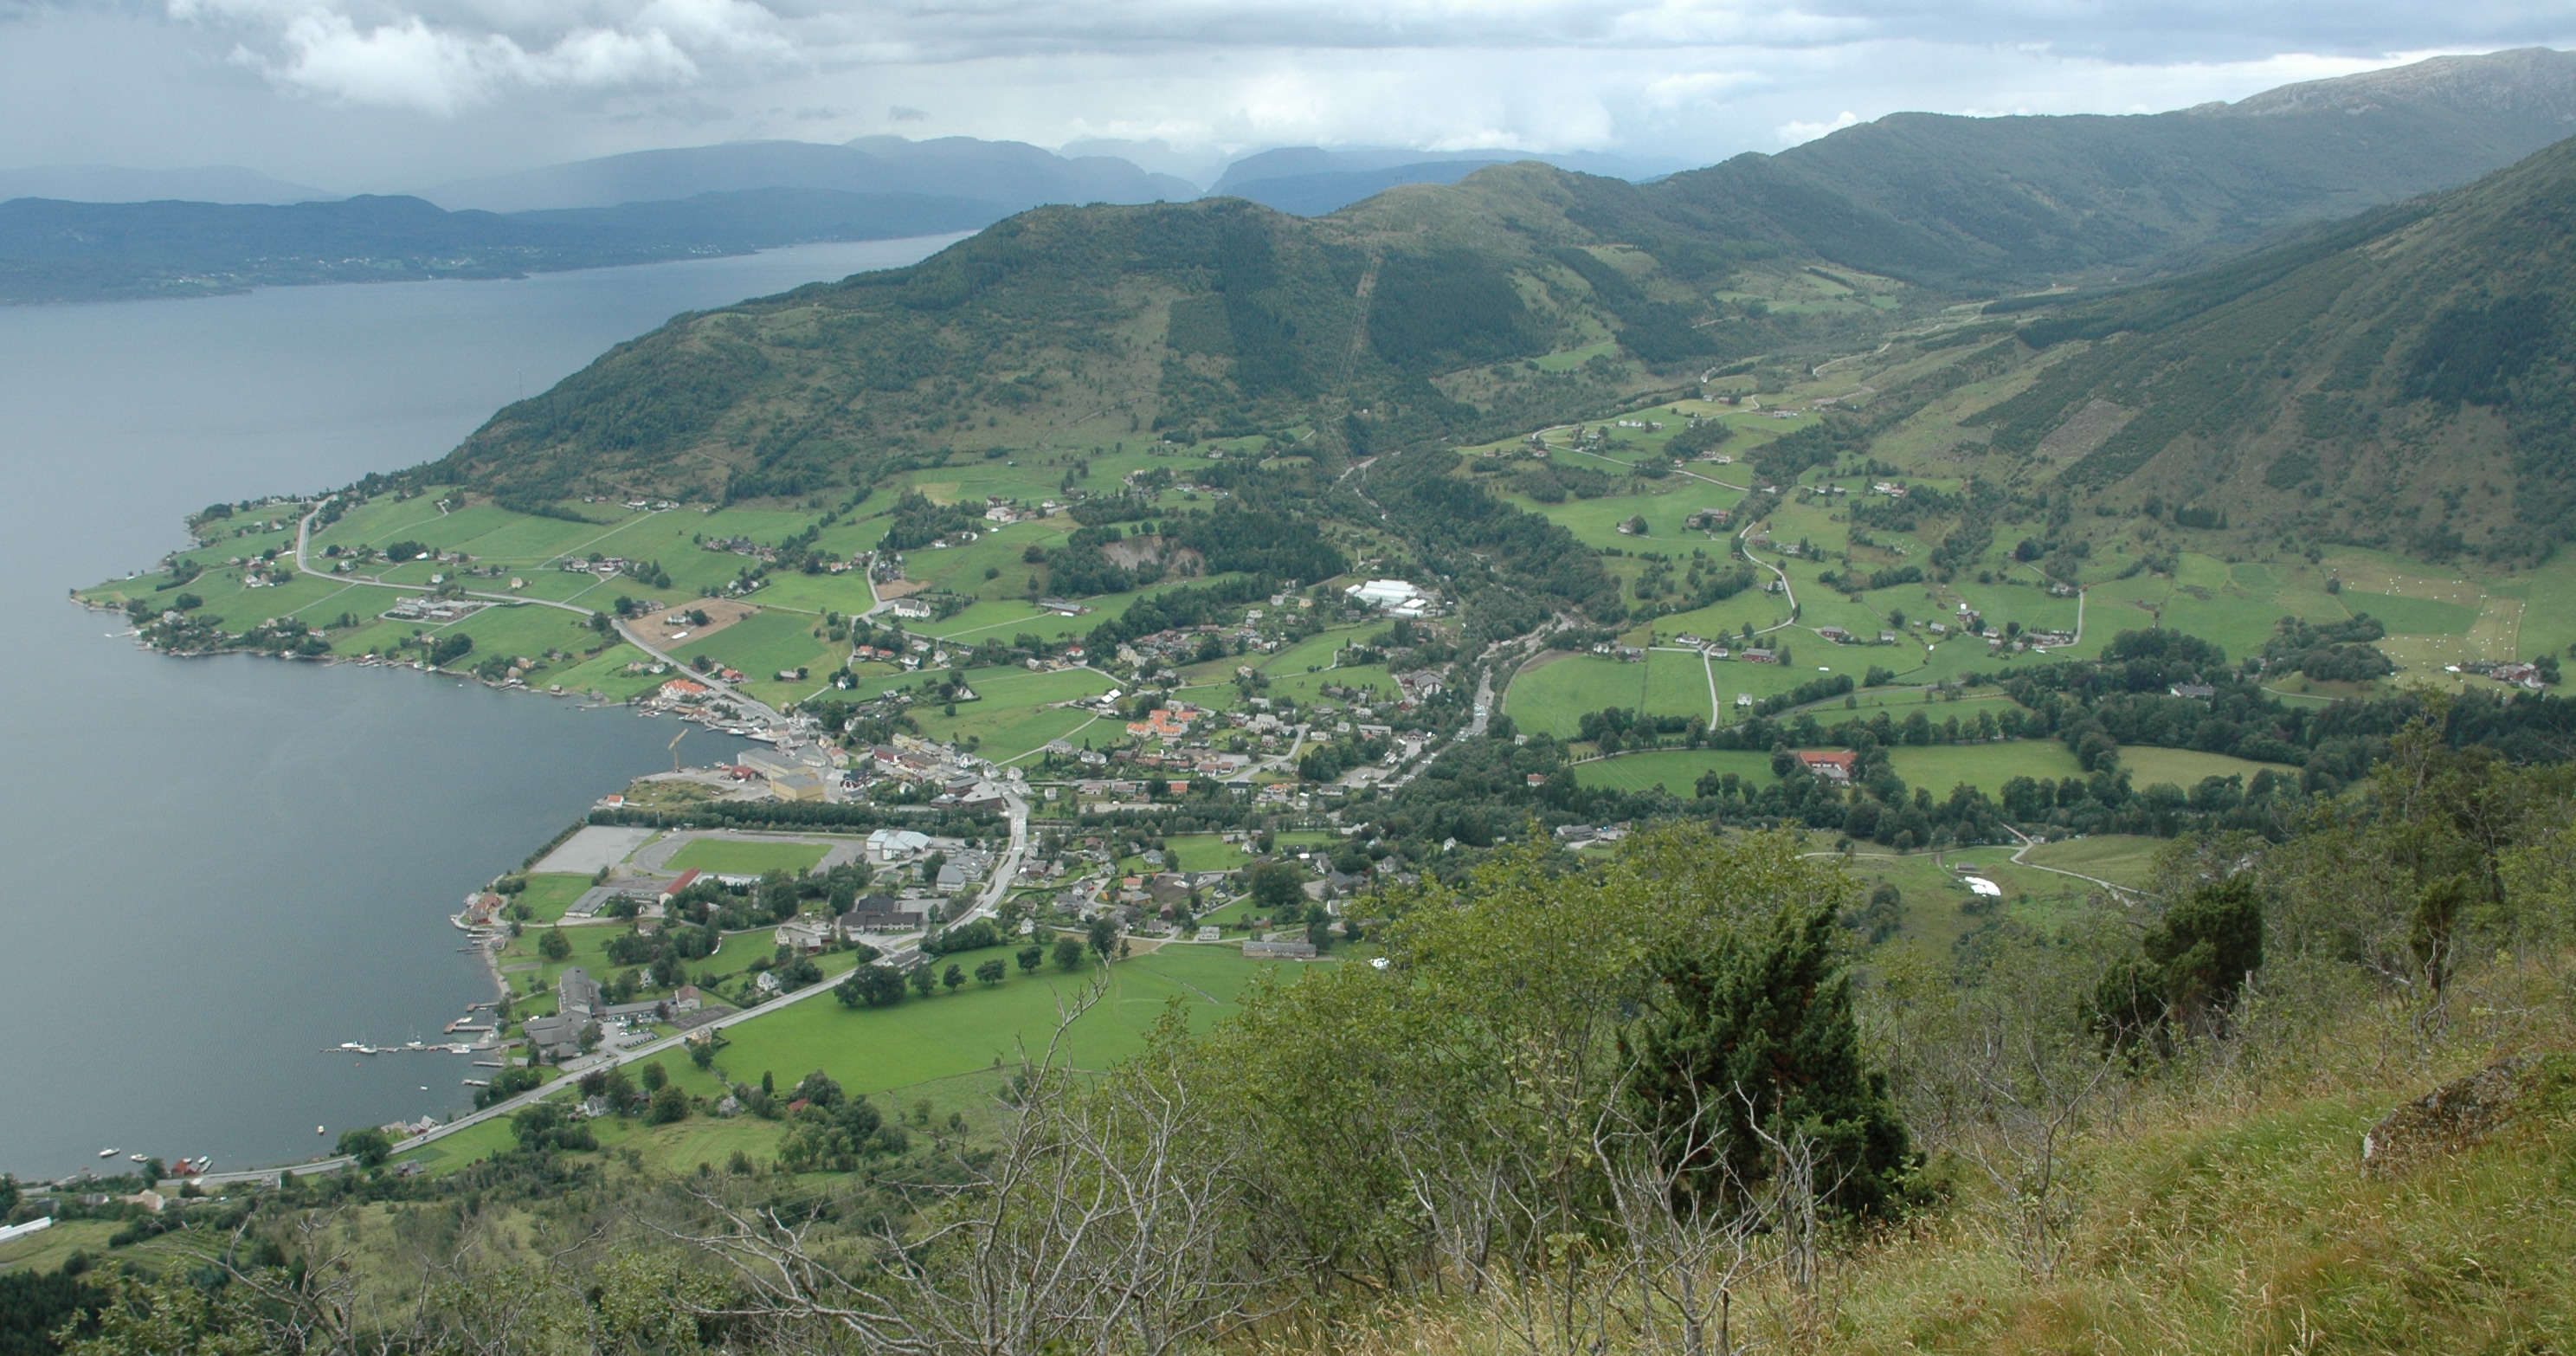
Hellandsbygd
Hellandsbygda or Hellandsbygd is a village in Sauda municipality in Rogaland county, Norway. The village is located in a river valley about 12 kilometres (7.5 mi) northeast of the town of Sauda. The village is surrounded by forested mountains with th..
Hellandsbygd Wikipedia Page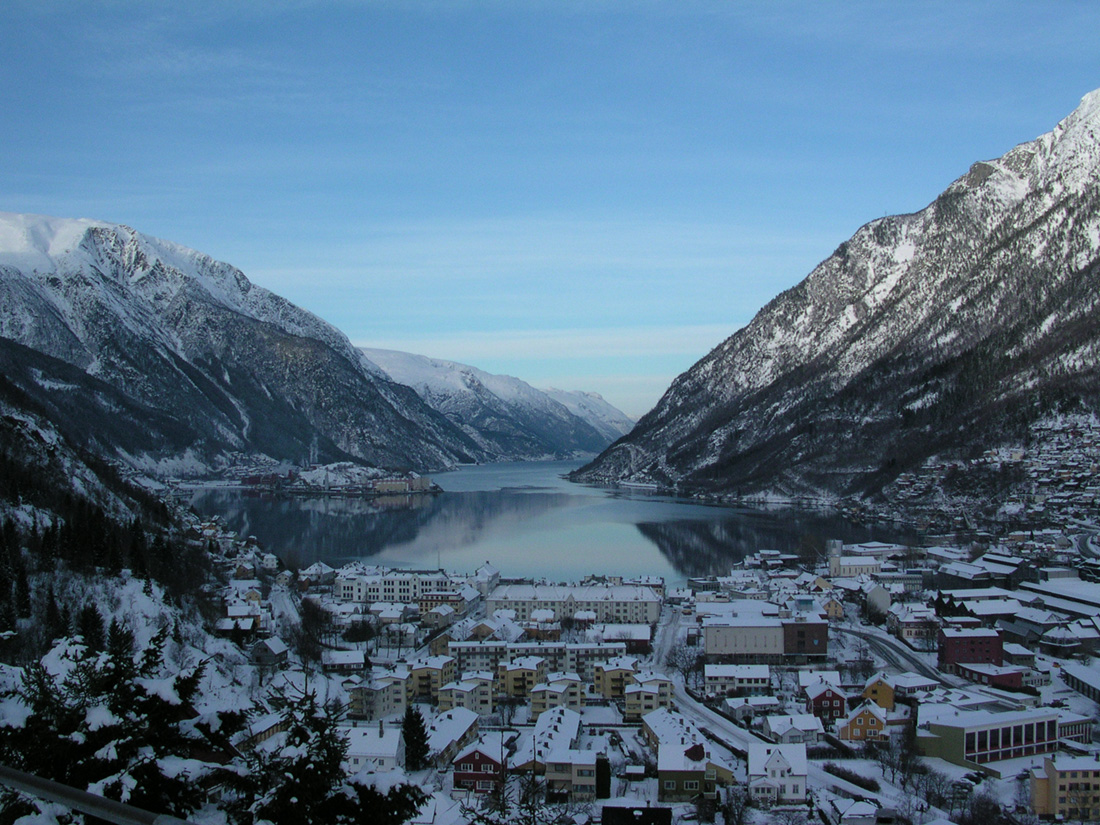

About Our Data
The data on this page is estimated using a number of publicly available tools and resources. It is provided without warranty, and could contain inaccuracies. Use at your own risk.