Industries
Business Distribution by Industry in Ilseng
| Industry Description | Number of Establishments |
|---|---|
| Unreachable | 37 |
| Construction of buildings | 22 |
| Buses and trains | 14 |
| Wholesale of machinery | 6 |
| Education | 5 |
| Corporate management | 5 |
Ilseng Facts
| Area | 1.8 km² |
| Population | 890 |
| Male Population | 440 (49.4%) |
| Female Population | 450 (50.6%) |
| Population change (1975 to 2020) | -34.2% |
| Population change (2000 to 2020) | -8.9% |
| Median Age | 42.3 years (Male: 41.1, Female: 43.6) |
| Local Time | |
| Timezone | Central European Summer Time |
| Lat & Lng | 60.77570, 11.22725 |
| Postal Codes | 2344 |
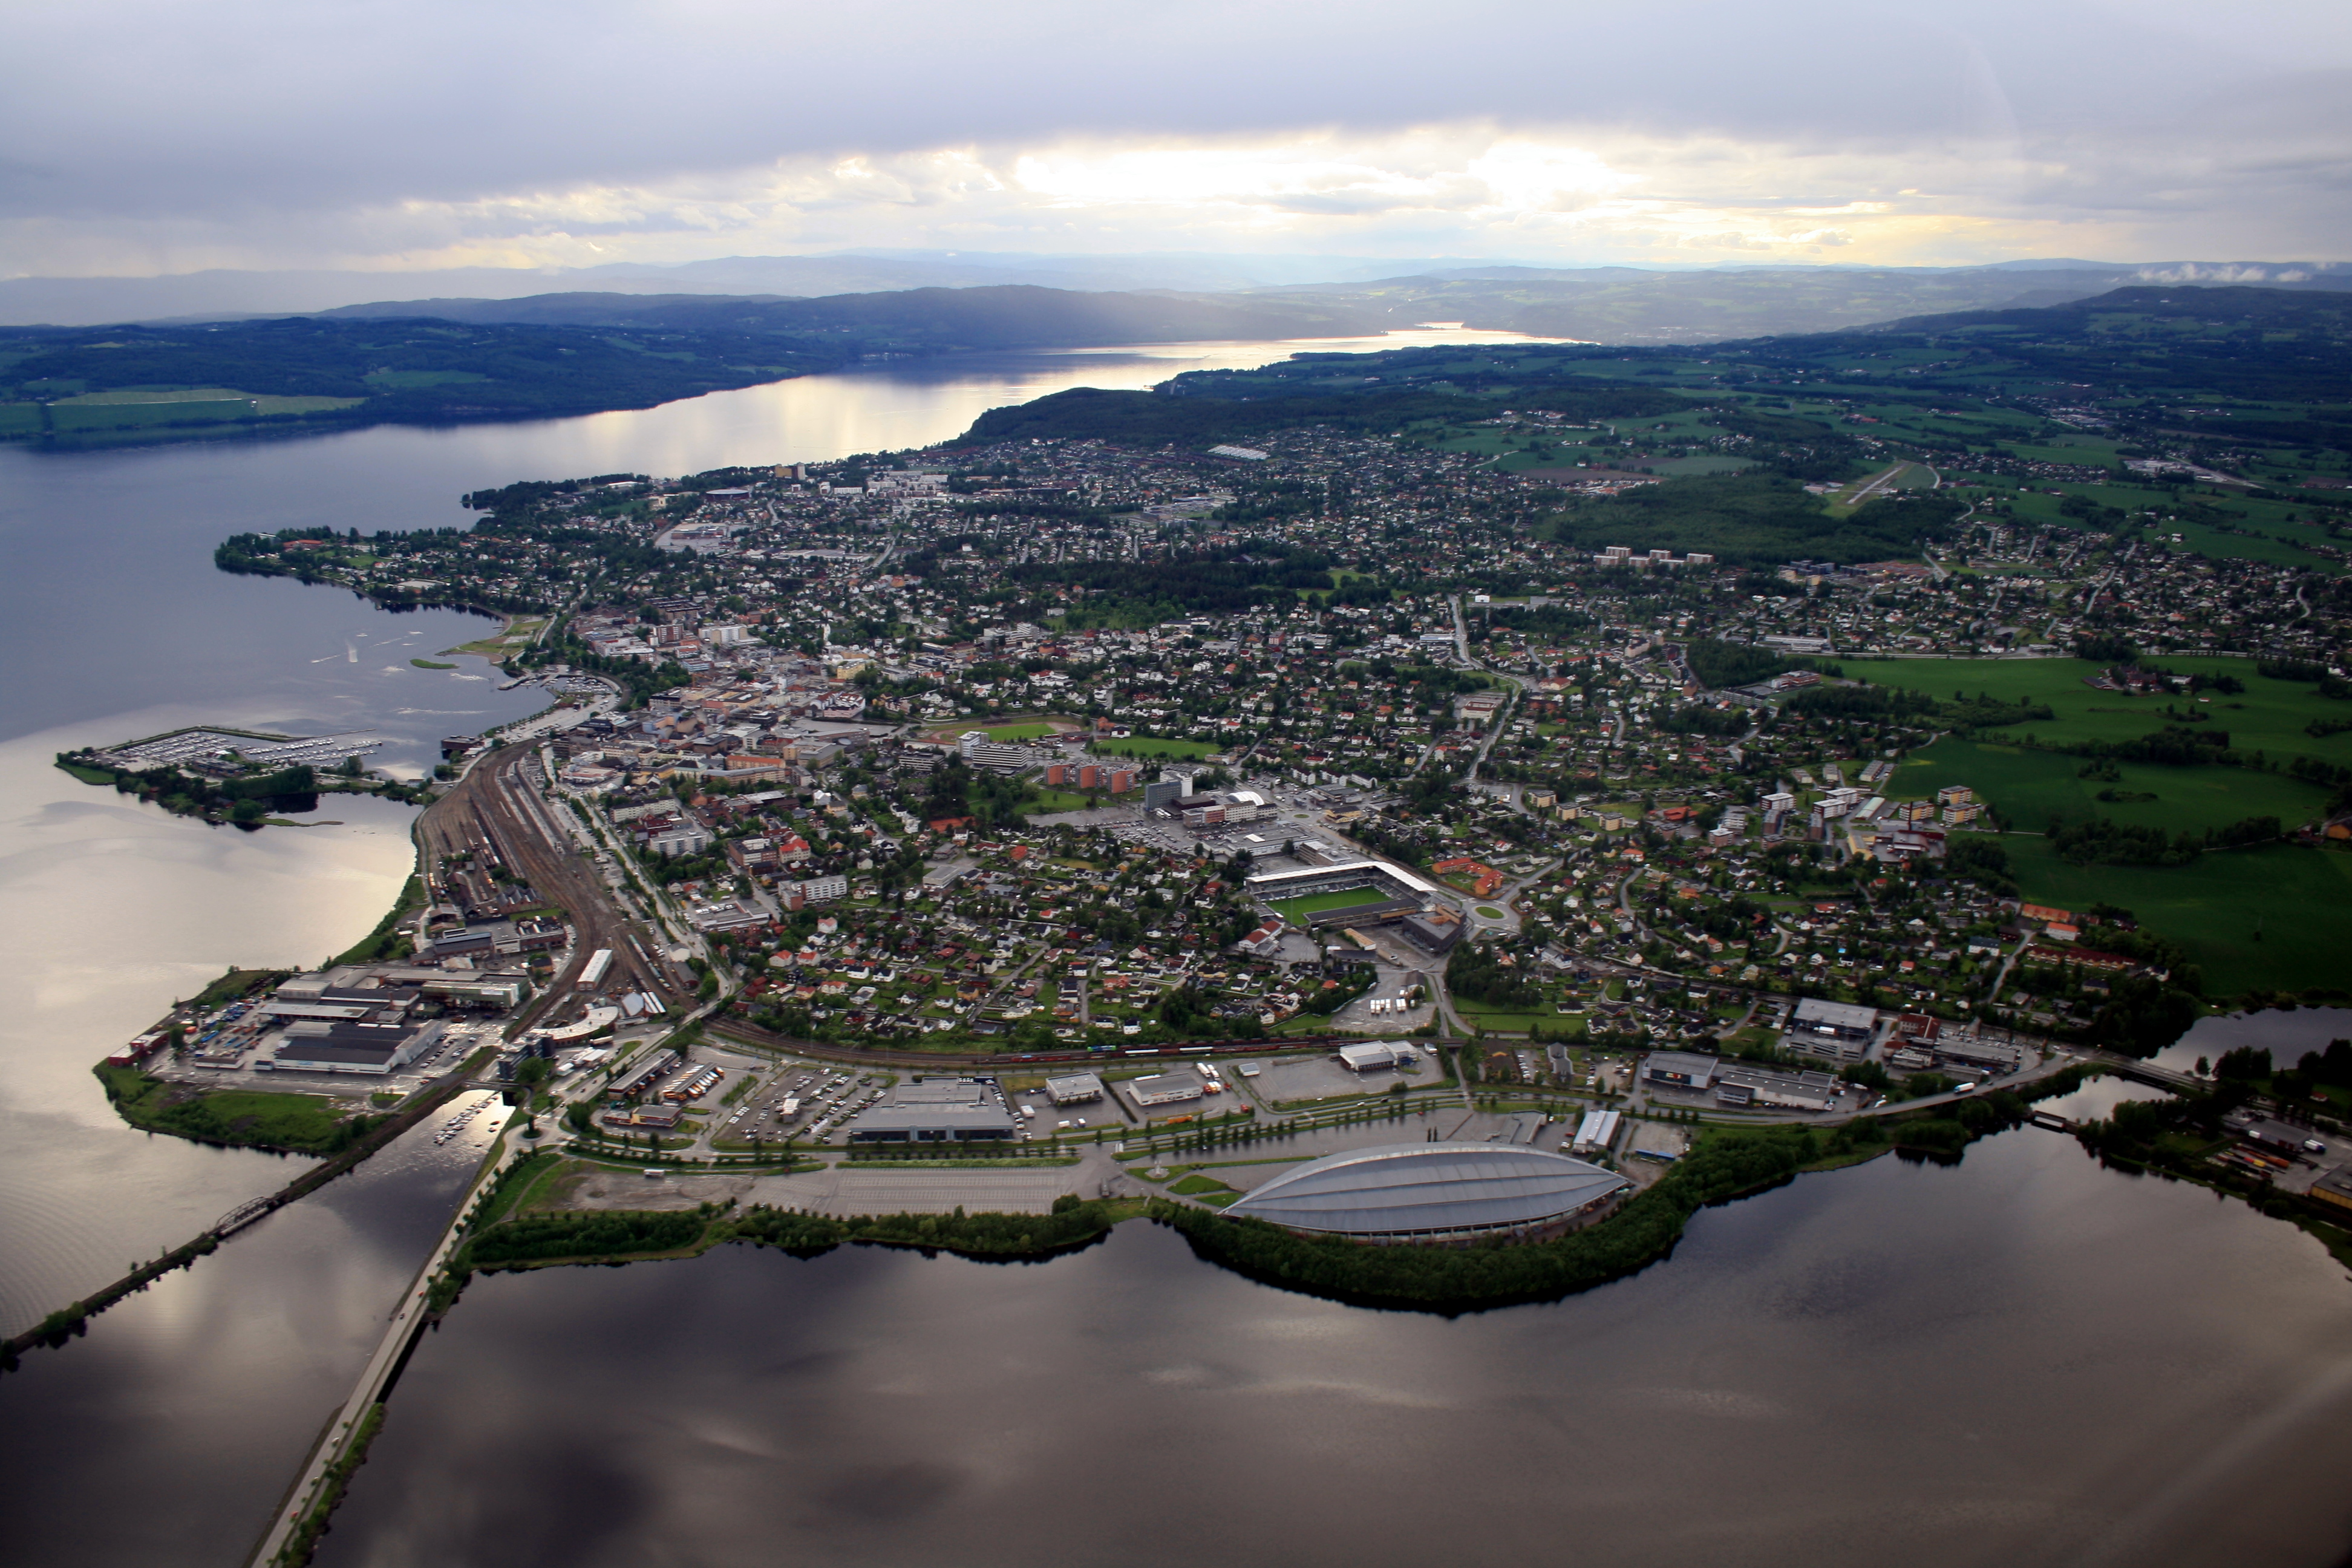
Map of Ilseng
Interactive Map
Ilseng Population
Years 1975 to 2020
| Data | 1975 | 1990 | 2000 | 2015 | 2020 |
|---|---|---|---|---|---|
| Population | 1,352 | 1,173 | 977 | 834 | 890 |
| Population Density | 772.6 / km² | 670.3 / km² | 558.3 / km² | 476.6 / km² | 508.6 / km² |
Ilseng Population change from 2000 to 2015
Decrease of 14.6% from year 2000 to 2015
| Location | Change since 1975 | Change since 1990 | Change since 2000 |
|---|---|---|---|
| Ilseng | -38.3% | -28.9% | -14.6% |
| Hedmark | -0.5% | +3.1% | +4.2% |
| Norway | +30.2% | +23.2% | +16.4% |
Ilseng Median Age
Median Age: 42.3 years
| Location | Median Age | Median Age (Female) | Median Age (Male) |
|---|---|---|---|
| Ilseng | 42.3 yrs | 43.6 yrs | 41.1 yrs |
| Hedmark | 43 yrs | 44.1 yrs | 41.8 yrs |
| Norway | 38.8 yrs | 39.6 yrs | 38 yrs |
Ilseng Population Density
Population Density: 509 / km²
| Location | Population | Area | Density |
|---|---|---|---|
| Ilseng | 890 | 1.75 km² | 509 / km² |
| Hedmark | 196,387 | 27,409.6 km² | 7.2 / km² |
| Norway | 4.9 million | 322,754.2 km² | 15.2 / km² |
Ilseng Historical and Projected Population
Estimated Population from 200 to 2100
- JRC (European Commission's Joint Research Centre) work on the GHS built-up grid
- CIESIN (Center for International Earth Science Information Network)
- [Link] Klein Goldewijk, K., Beusen, A., Doelman, J., and Stehfest, E.: Anthropogenic land use estimates for the Holocene – HYDE 3.2, Earth Syst. Sci. Data, 9, 927–953, https://doi.org/10.5194/essd-9-927-2017, 2017.
Area Codes
Percentage Area Codes used by businesses in Ilseng
Human Development Index (HDI)
Statistic composite index of life expectancy, education, and per capita income.
Ilseng CO2 Emissions
Carbon Dioxide (CO2) Emissions Per Capita in Tonnes Per Year
| Location | CO2 Emissions | CO2 Emissions Per Capita | CO2 Emissions Intensity |
|---|---|---|---|
| Ilseng | 16,063 tn | 18.05 tn | 9,178.8 tons/km² |
| Hedmark | 3,538,521 tn | 18.02 tn | 129.1 tons/km² |
| Norway | 86,855,170 tn | 17.74 tn | 269.1 tons/km² |
| 2013 CO2 emissions (tonnes/year) | 16,063 tn |
| 2013 CO2 emissions (tonnes/year) per capita | 18.05 tn |
| 2013 CO2 emissions intensity (tonnes/km²/year) | 9,178.8 tons/km² |
Recent Nearby Earthquakes
Magnitude 3.0 and greater
| Date▼ | Time↕ | Magnitude↕ | Distance↕ | Depth↕ | Location↕ | Link |
|---|---|---|---|---|---|---|
| 4/7/04 | 8:53 AM | 3.4 | 34.5 km | 22,900 m | southern Norway | usgs.gov |
| 11/19/94 | 9:07 AM | 3.5 | 70.6 km | 10,000 m | southern Norway | usgs.gov |
| 11/27/93 | 6:57 PM | 3.1 | 47.3 km | 10,000 m | southern Norway | usgs.gov |
Ilseng
Ilseng was a village in the municipality of Stange, Norway. Its population (2005) was 876, of which 22 people lived within the border of the neighboring municipality Hamar. railway station was served by Rørosbanen, and was the first stop after Hamar..
Ilseng Wikipedia Page

About Our Data
The data on this page is estimated using a number of publicly available tools and resources. It is provided without warranty, and could contain inaccuracies. Use at your own risk.