Kiberg Facts
| Area | 1.0 km² |
| Population | 226 |
| Population change (1975 to 2020) | -62.4% |
| Population change (2000 to 2020) | -24.7% |
| Local Time | |
| Timezone | Central European Summer Time |
| Lat & Lng | 70.28537, 30.99727 |
| Postal Codes | 9960 |
Map of Kiberg
Interactive Map
Kiberg Population
Years 1975 to 2020
| Data | 1975 | 1990 | 2000 | 2015 | 2020 |
|---|---|---|---|---|---|
| Population | 601 | 395 | 300 | 218 | 226 |
| Population Density | 601 / km² | 395 / km² | 300 / km² | 218 / km² | 226 / km² |
Sources: JRC (European Commission's Joint Research Centre) work on the GHS built-up grid
Kiberg Population change from 2000 to 2015
Decrease of 27.3% from year 2000 to 2015
| Location | Change since 1975 | Change since 1990 | Change since 2000 |
|---|---|---|---|
| Kiberg | -63.7% | -44.8% | -27.3% |
| Finnmark | -14.8% | -4.8% | -0.1% |
| Norway | +30.2% | +23.2% | +16.4% |
Sources: JRC (European Commission's Joint Research Centre) work on the GHS built-up grid
Kiberg Population Density
Population Density: 226 / km²
| Location | Population | Area | Density |
|---|---|---|---|
| Kiberg | 226 | 1 km² | 226 / km² |
| Finnmark | 75,051 | 74,273.1 km² | 1 / km² |
| Norway | 4.9 million | 322,754.2 km² | 15.2 / km² |
Sources: JRC (European Commission's Joint Research Centre) work on the GHS built-up grid
Kiberg Historical and Projected Population
Estimated Population from 0 to 2100
Sources:
- JRC (European Commission's Joint Research Centre) work on the GHS built-up grid
- CIESIN (Center for International Earth Science Information Network)
- [Link] Klein Goldewijk, K., Beusen, A., Doelman, J., and Stehfest, E.: Anthropogenic land use estimates for the Holocene – HYDE 3.2, Earth Syst. Sci. Data, 9, 927–953, https://doi.org/10.5194/essd-9-927-2017, 2017.
Human Development Index (HDI)
Statistic composite index of life expectancy, education, and per capita income.
Source: [Link] Kummu, M., Taka, M. &Guillaume, J. Gridded global datasets for Gross Domestic Product and Human Development Index over 1990–2015. Sci Data 5, 180004 (2018) doi:10.1038/sdata.2018.4
Kiberg CO2 Emissions
Carbon Dioxide (CO2) Emissions Per Capita in Tonnes Per Year
| Location | CO2 Emissions | CO2 Emissions Per Capita | CO2 Emissions Intensity |
|---|---|---|---|
| Kiberg | 4,148 tn | 18.35 tn | 4,147.9 tons/km² |
| Finnmark | 888,612 tn | 11.84 tn | 12 tons/km² |
| Norway | 86,855,170 tn | 17.74 tn | 269.1 tons/km² |
Sources: [Link] Moran, D., Kanemoto K; Jiborn, M., Wood, R., Többen, J., and Seto, K.C. (2018) Carbon footprints of 13,000 cities. Environmental Research Letters DOI: 10.1088/1748-9326/aac72a
Kiberg CO2 Emissions
| 2013 CO2 emissions (tonnes/year) | 4,148 tn |
| 2013 CO2 emissions (tonnes/year) per capita | 18.35 tn |
| 2013 CO2 emissions intensity (tonnes/km²/year) | 4,147.9 tons/km² |
Recent Nearby Earthquakes
Magnitude 3.0 and greater
| Date▼ | Time↕ | Magnitude↕ | Distance↕ | Depth↕ | Location↕ | Link |
|---|---|---|---|---|---|---|
| 6/14/95 | 12:24 PM | 3 | 39.5 km | 10,000 m | Barents Sea | usgs.gov |
Source: U.S. Geological Survey (USGS)
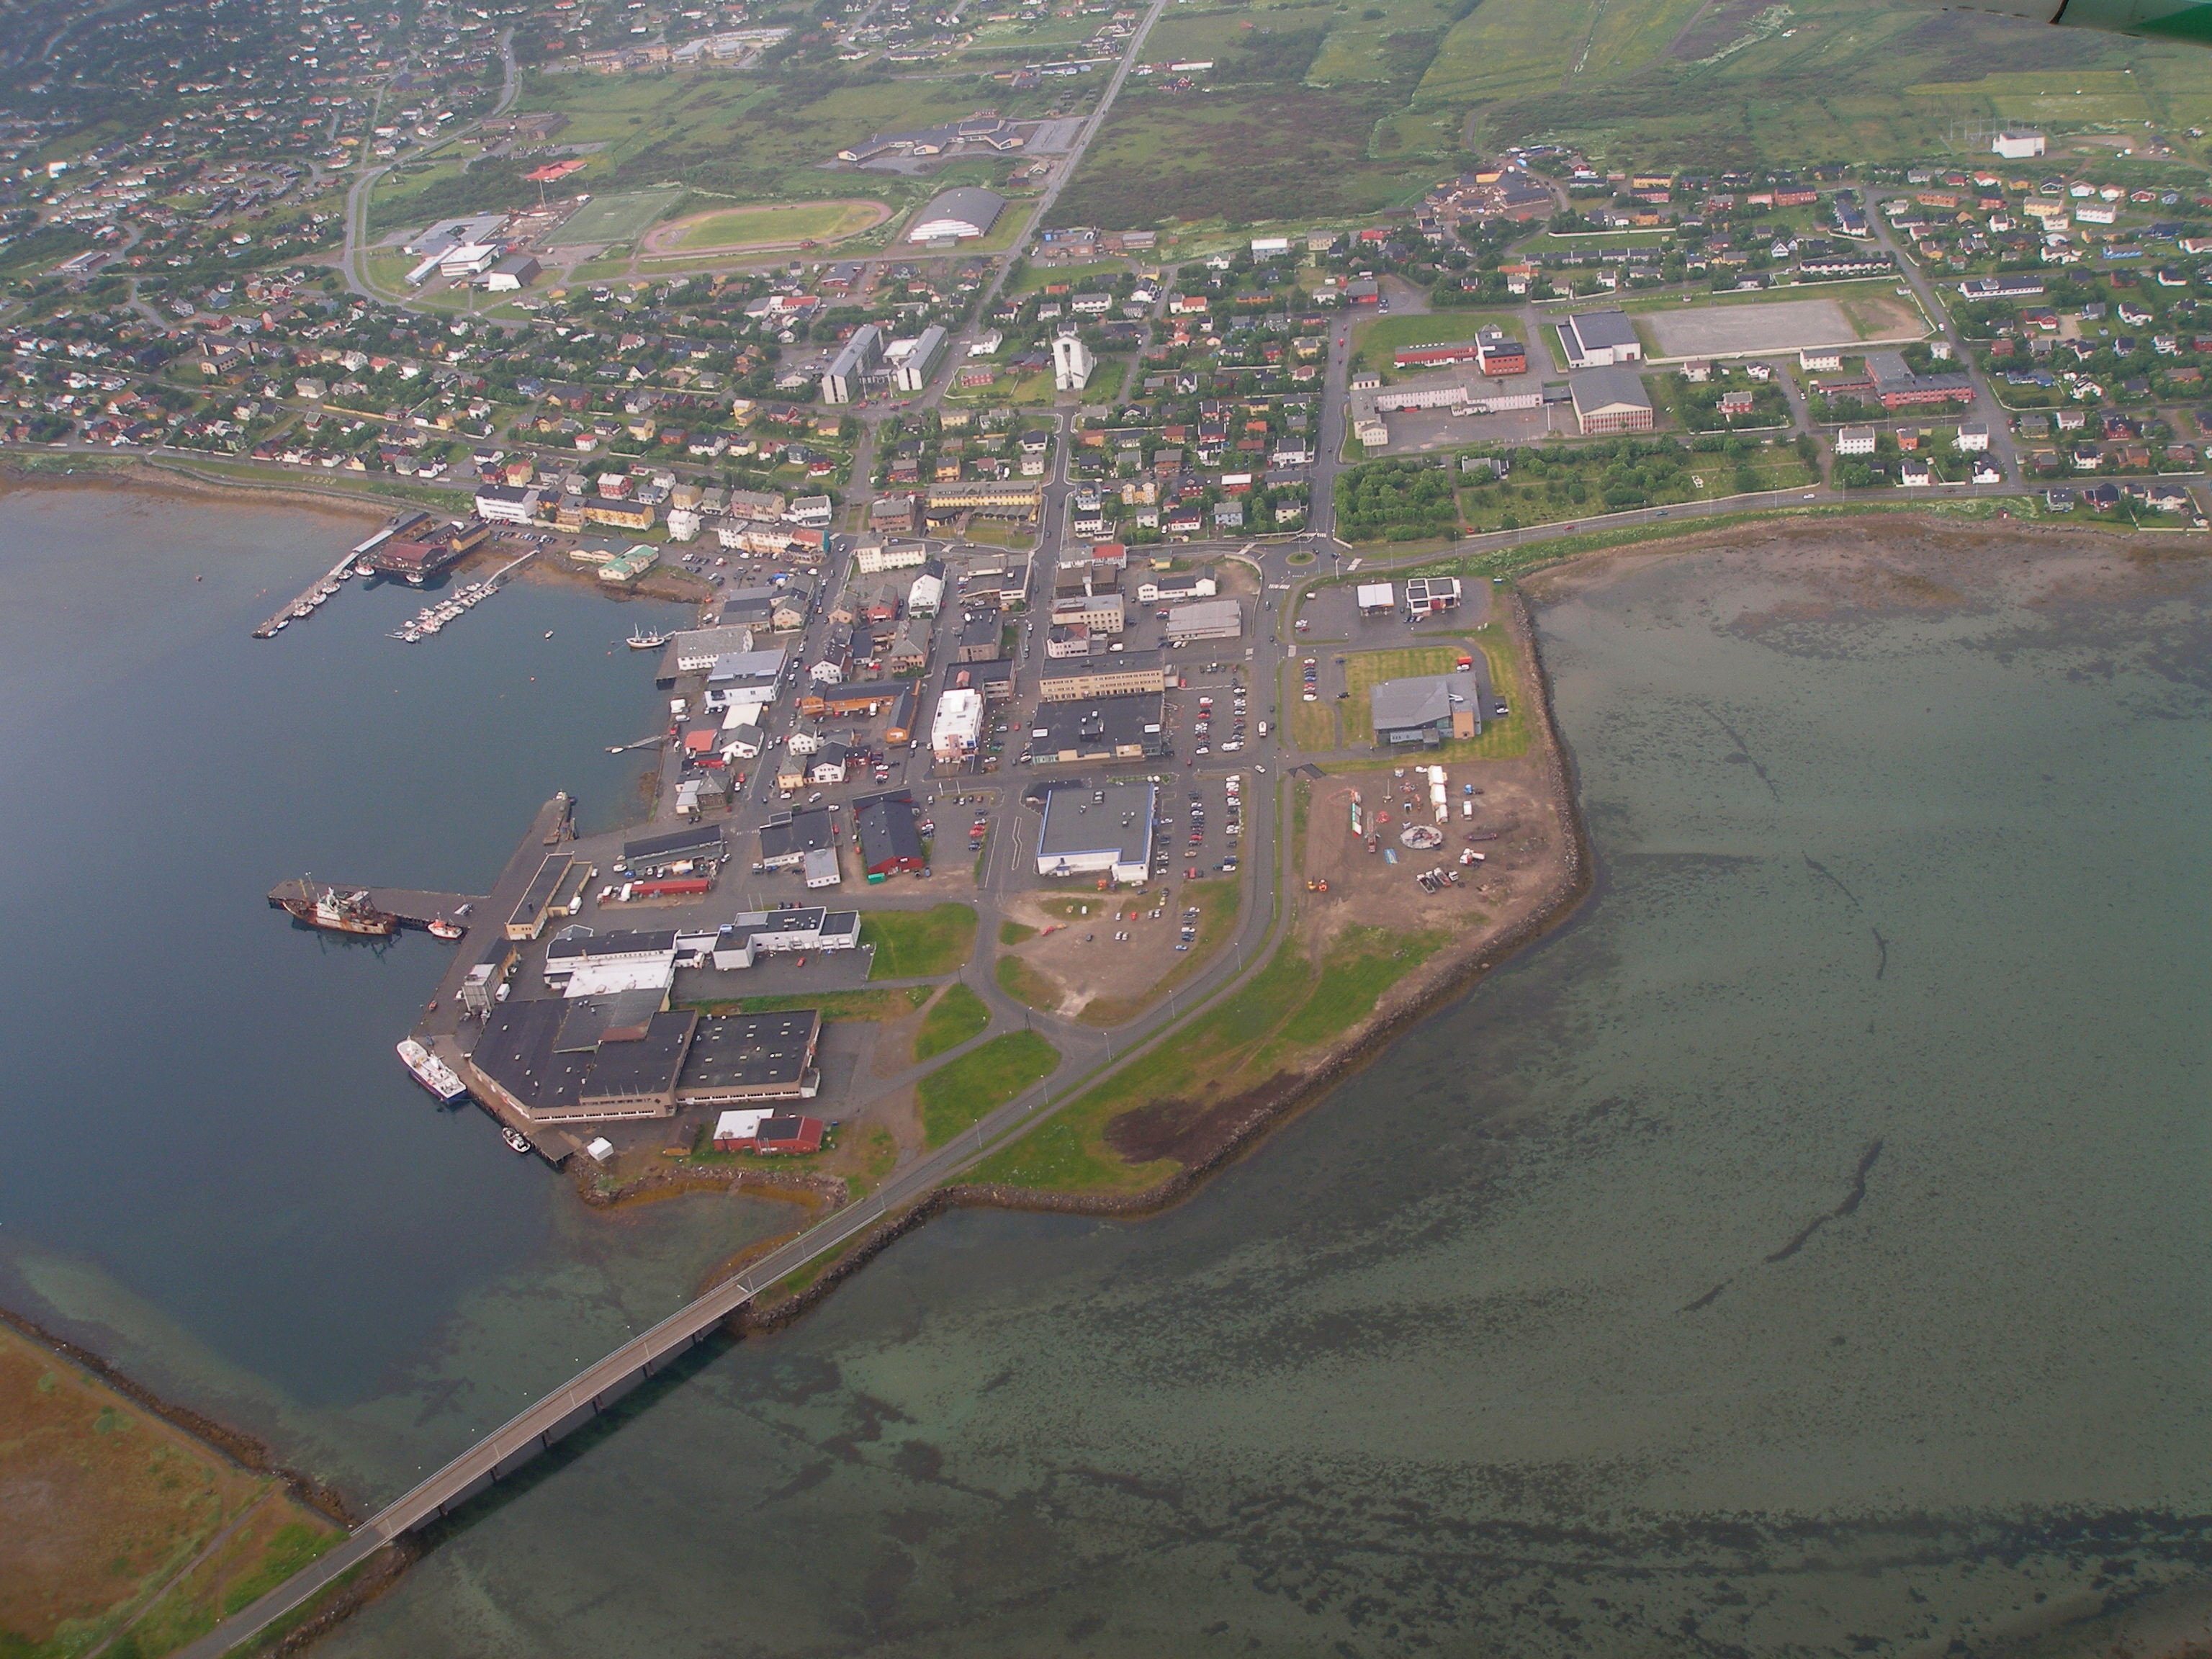
Kiberg
Kiberg (Kven: Kiiperi) is a village in Vardø Municipality in eastern Finnmark county, Norway. It is located on the eastern end of the Varanger Peninsula, along the Barents Sea. Kiberg is the second largest settlement in Vardø municipality. It is situ..
Kiberg Wikipedia Page
About Our Data
The data on this page is estimated using a number of publicly available tools and resources. It is provided without warranty, and could contain inaccuracies. Use at your own risk.