Categories in Stange
Car repairCar Repair and MaintenanceCar WashGas StationTire ShopDairy FarmFarmingImport Export CompanyIndustrial & Construction ManufacturingWood IndustryClothing storesAssociation or OrganizationConstruction of buildingsContractorHome Repair ContractorInterior Construction ContractorPainting and paint contractorsPlumbing installation and repairEducationKindergartenArtistArts & DesignMuseumsMusic RelatedTourist AttractionBakeriesCafesGrocery stores and supermarketsRestaurantsPet grooming and boardingInvestment CompanyDentistsGeneral practitionersBeauty salonsHair SalonAdvertising ServiceBack OfficeBusiness Management ConsultantBusiness to Business ServiceConsulting & Advisory ServicesReal Estate AgencyResidential Property RentalsFarm and ranchFloristsGarden CenterShoppingSports clubsBus StationLodgingTaxis
Showing 1-50 of 54
Industries
Business Distribution by Industry in Stange
| Industry Description | Number of Establishments | Average Age of Business |
|---|---|---|
| Unreachable | 153 | — |
| Construction of buildings | 65 | 18 years |
| Buses and trains | 38 | — |
| Education | 20 | — |
| Wholesale of machinery | 18 | — |
| Corporate management | 17 | — |
| Electronics stores | 16 | — |
| Other construction | 15 | — |
Stange Facts
| Area | 1.7 km² |
| Population | 1,819 |
| Male Population | 903 (49.6%) |
| Female Population | 916 (50.4%) |
| Population change (1975 to 2020) | -19.0% |
| Population change (2000 to 2020) | -11.9% |
| Median Age | 42.2 years (Male: 41.2, Female: 43.3) |
| Neighborhoods | Alna |
| Local Time | |
| Timezone | Central European Summer Time |
| Lat & Lng | 60.71803, 11.19417 |
| Postal Codes | 2332, 2335, 2336 |
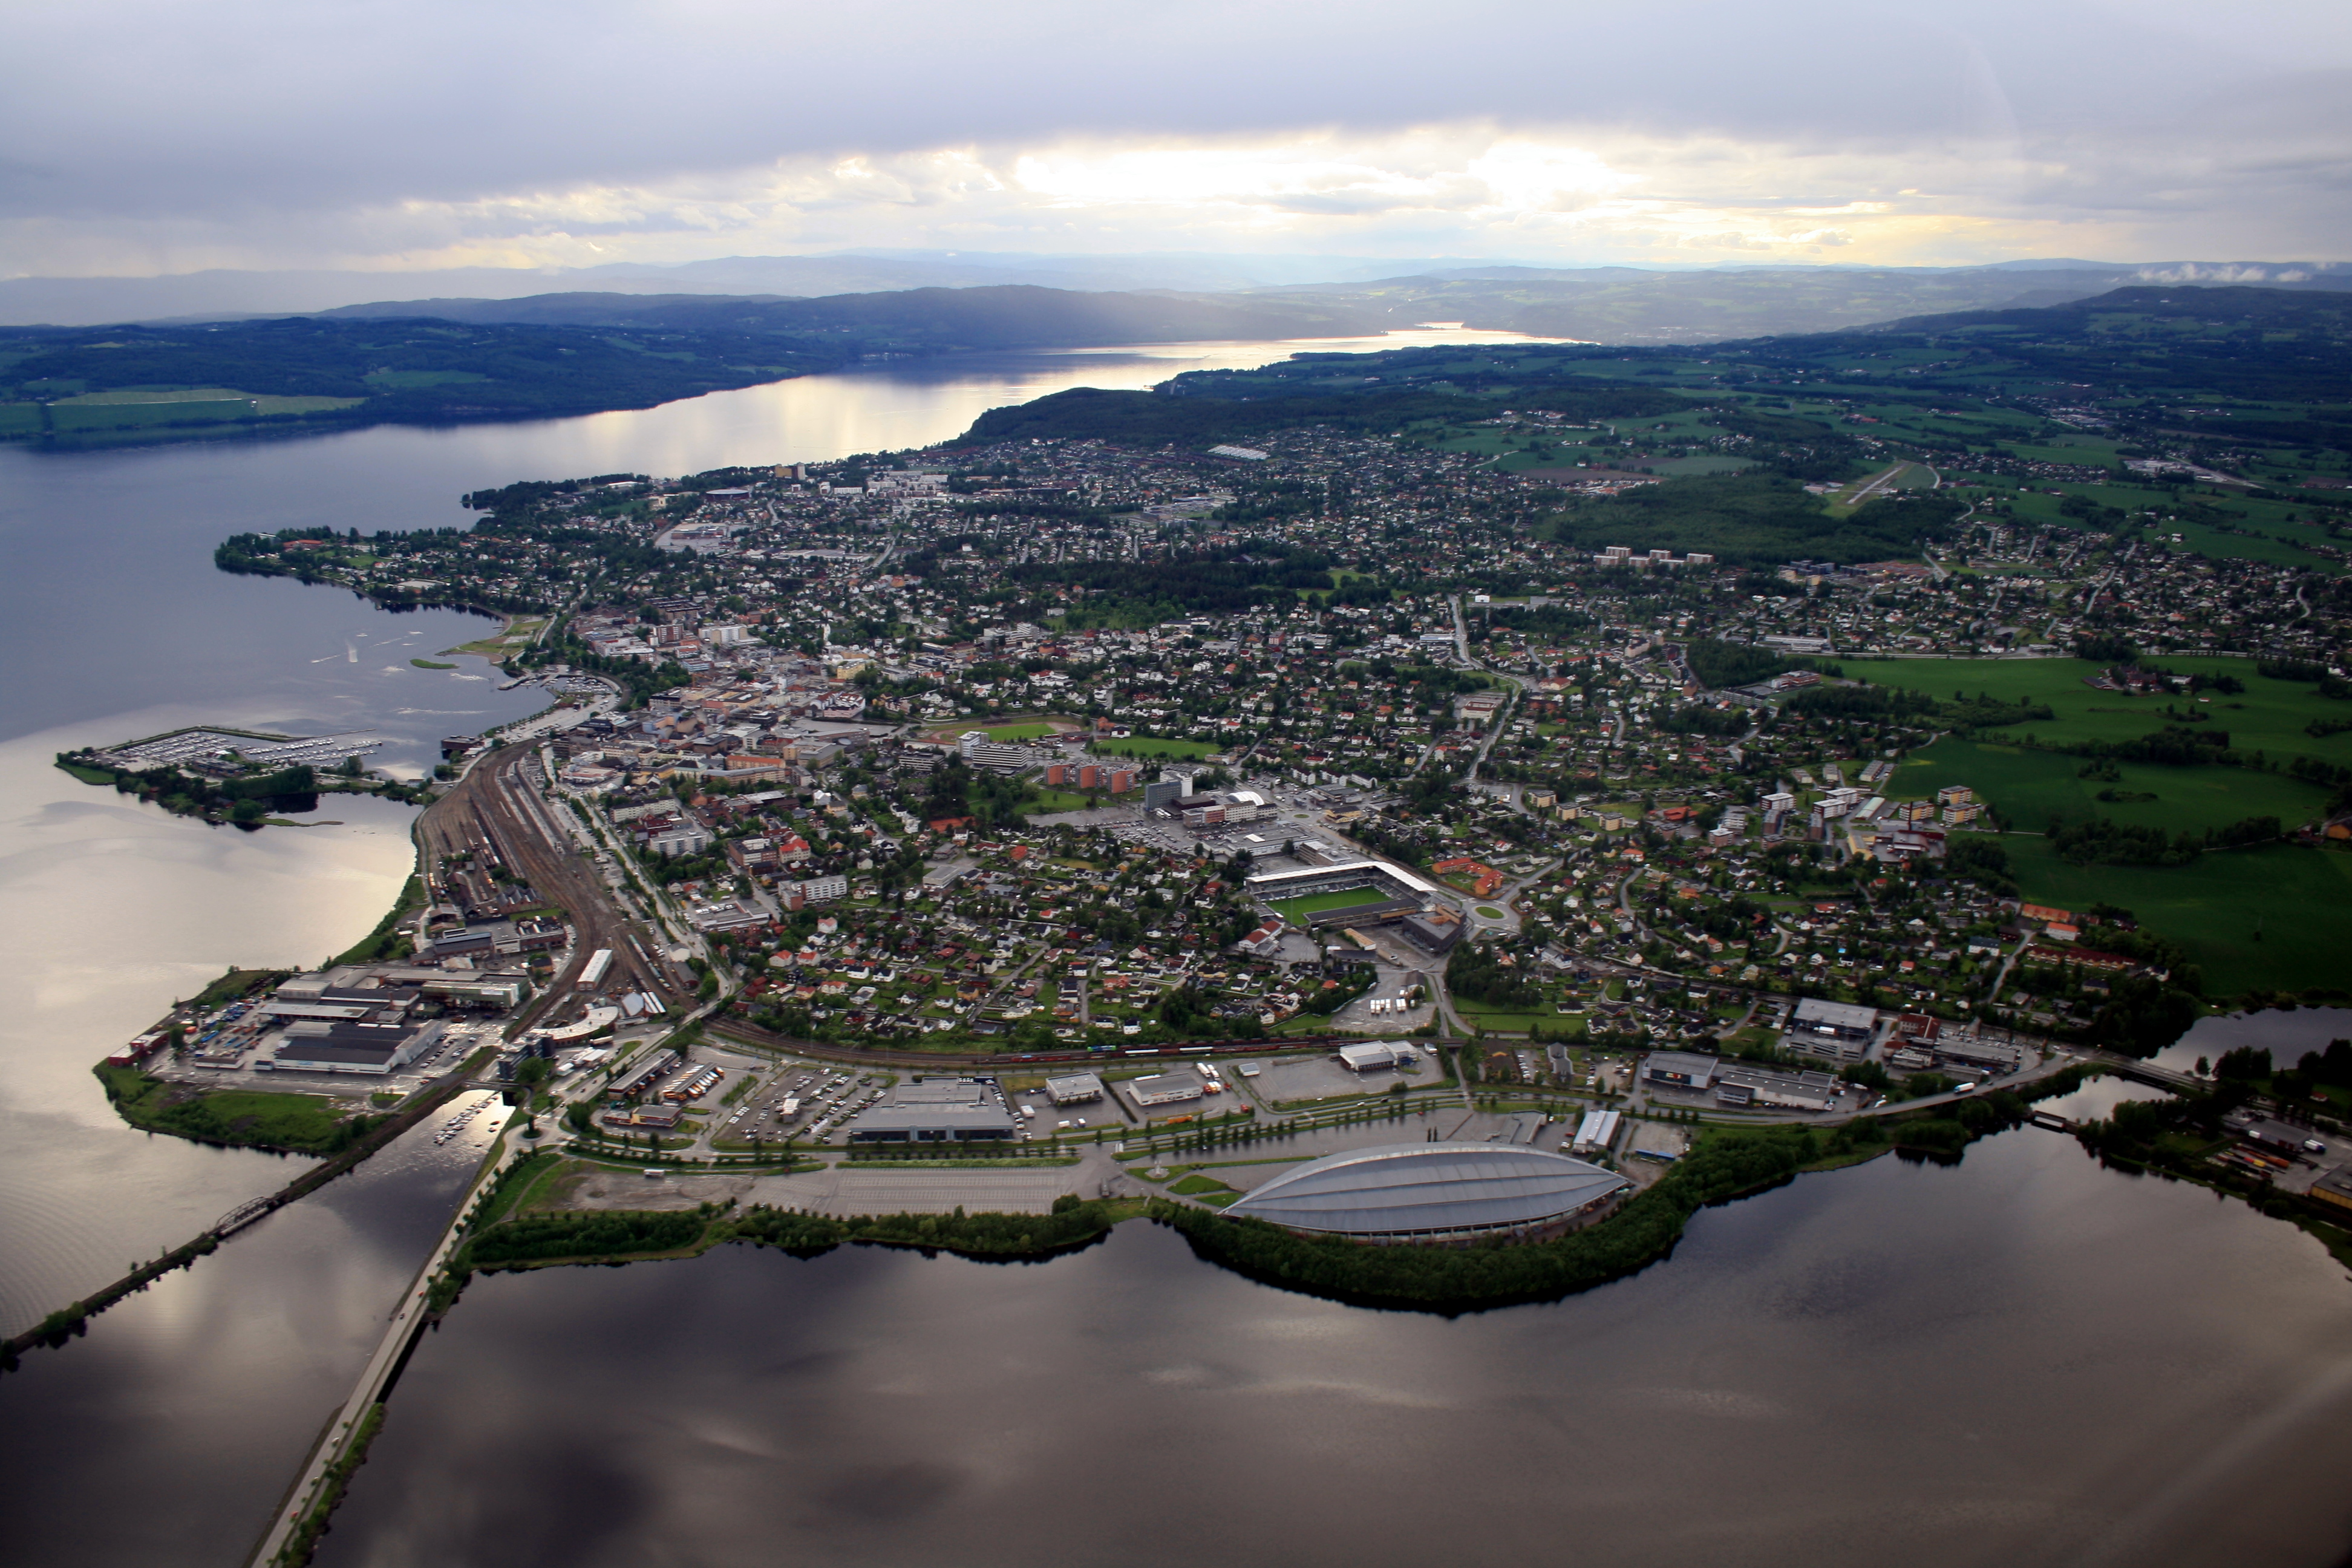
Map of Stange
Interactive Map
Stange Population
Years 1975 to 2020
| Data | 1975 | 1990 | 2000 | 2015 | 2020 |
|---|---|---|---|---|---|
| Population | 2,247 | 1,938 | 2,065 | 1,724 | 1,819 |
| Population Density | 1,331.6 / km² | 1,148.4 / km² | 1,223.7 / km² | 1,021.6 / km² | 1,077.9 / km² |
Sources: JRC (European Commission's Joint Research Centre) work on the GHS built-up grid
Stange Population change from 2000 to 2015
Decrease of 16.5% from year 2000 to 2015
| Location | Change since 1975 | Change since 1990 | Change since 2000 |
|---|---|---|---|
| Stange | -23.3% | -11% | -16.5% |
| Hedmark | -0.5% | +3.1% | +4.2% |
| Norway | +30.2% | +23.2% | +16.4% |
Sources: JRC (European Commission's Joint Research Centre) work on the GHS built-up grid
Stange Median Age
Median Age: 42.2 years
| Location | Median Age | Median Age (Female) | Median Age (Male) |
|---|---|---|---|
| Stange | 42.2 yrs | 43.3 yrs | 41.2 yrs |
| Hedmark | 43 yrs | 44.1 yrs | 41.8 yrs |
| Norway | 38.8 yrs | 39.6 yrs | 38 yrs |
Sources: CIESIN (Center for International Earth Science Information Network)
Stange Population Density
Population Density: 1,078 / km²
| Location | Population | Area | Density |
|---|---|---|---|
| Stange | 1,819 | 1.688 km² | 1,078 / km² |
| Hedmark | 196,387 | 27,409.6 km² | 7.2 / km² |
| Norway | 4.9 million | 322,754.2 km² | 15.2 / km² |
Sources: JRC (European Commission's Joint Research Centre) work on the GHS built-up grid
Stange Historical and Projected Population
Estimated Population from 1100 to 2100
Sources:
- JRC (European Commission's Joint Research Centre) work on the GHS built-up grid
- CIESIN (Center for International Earth Science Information Network)
- [Link] Klein Goldewijk, K., Beusen, A., Doelman, J., and Stehfest, E.: Anthropogenic land use estimates for the Holocene – HYDE 3.2, Earth Syst. Sci. Data, 9, 927–953, https://doi.org/10.5194/essd-9-927-2017, 2017.
Area Codes
Percentage Area Codes used by businesses in Stange
Postal Codes
Percentage of businesses by Postal Codes in Stange
Price Distribution
Business distribution by price for Stange
Human Development Index (HDI)
Statistic composite index of life expectancy, education, and per capita income.
Source: [Link] Kummu, M., Taka, M. &Guillaume, J. Gridded global datasets for Gross Domestic Product and Human Development Index over 1990–2015. Sci Data 5, 180004 (2018) doi:10.1038/sdata.2018.4
Stange CO2 Emissions
Carbon Dioxide (CO2) Emissions Per Capita in Tonnes Per Year
| Location | CO2 Emissions | CO2 Emissions Per Capita | CO2 Emissions Intensity |
|---|---|---|---|
| Stange | 32,830 tn | 18.05 tn | 19,454.6 tons/km² |
| Hedmark | 3,538,521 tn | 18.02 tn | 129.1 tons/km² |
| Norway | 86,855,170 tn | 17.74 tn | 269.1 tons/km² |
Sources: [Link] Moran, D., Kanemoto K; Jiborn, M., Wood, R., Többen, J., and Seto, K.C. (2018) Carbon footprints of 13,000 cities. Environmental Research Letters DOI: 10.1088/1748-9326/aac72a
Stange CO2 Emissions
| 2013 CO2 emissions (tonnes/year) | 32,830 tn |
| 2013 CO2 emissions (tonnes/year) per capita | 18.05 tn |
| 2013 CO2 emissions intensity (tonnes/km²/year) | 19,454.6 tons/km² |
Recent Nearby Earthquakes
Magnitude 3.0 and greater
| Date▼ | Time↕ | Magnitude↕ | Distance↕ | Depth↕ | Location↕ | Link |
|---|---|---|---|---|---|---|
| 4/7/04 | 8:53 AM | 3.4 | 29.8 km | 22,900 m | southern Norway | usgs.gov |
| 11/19/94 | 9:07 AM | 3.5 | 64.1 km | 10,000 m | southern Norway | usgs.gov |
| 11/27/93 | 6:57 PM | 3.1 | 41.8 km | 10,000 m | southern Norway | usgs.gov |
Source: U.S. Geological Survey (USGS)


About Our Data
The data on this page is estimated using a number of publicly available tools and resources. It is provided without warranty, and could contain inaccuracies. Use at your own risk.