Categories in Tomter
Industries
Business Distribution by Industry in Tomter
| Industry Description | Number of Establishments |
|---|---|
| Unreachable | 73 |
| Construction of buildings | 32 |
| Wholesale of machinery | 13 |
| Education | 12 |
| Corporate management | 11 |
| Car repair | 10 |
| Other construction | 9 |
| Shopping | 8 |
| Civil engineering | 8 |
| Other transport activities | 7 |
Map of Tomter
Interactive Map
Tomter Population
Years 1975 to 2020
| Data | 1975 | 1990 | 2000 | 2015 | 2020 |
|---|---|---|---|---|---|
| Population | 837 | 682 | 510 | 451 | 477 |
| Population Density | 1,030.2 / km² | 839.4 / km² | 627.7 / km² | 555.1 / km² | 587.1 / km² |
Tomter Population change from 2000 to 2015
Decrease of 11.6% from year 2000 to 2015
| Location | Change since 1975 | Change since 1990 | Change since 2000 |
|---|---|---|---|
| Tomter | -46.1% | -33.9% | -11.6% |
| Østfold | +34.2% | +23.8% | +15.9% |
| Norway | +30.2% | +23.2% | +16.4% |
Tomter Population Density
Population Density: 587 / km²
| Location | Population | Area | Density |
|---|---|---|---|
| Tomter | 477 | 0.813 km² | 587 / km² |
| Østfold | 290,600 | 5,068.4 km² | 57.3 / km² |
| Norway | 4.9 million | 322,754.2 km² | 15.2 / km² |
Tomter Historical and Projected Population
Estimated Population from 0 to 2100
- JRC (European Commission's Joint Research Centre) work on the GHS built-up grid
- CIESIN (Center for International Earth Science Information Network)
- [Link] Klein Goldewijk, K., Beusen, A., Doelman, J., and Stehfest, E.: Anthropogenic land use estimates for the Holocene – HYDE 3.2, Earth Syst. Sci. Data, 9, 927–953, https://doi.org/10.5194/essd-9-927-2017, 2017.
Area Codes
Percentage Area Codes used by businesses in Tomter
Price Distribution
Business distribution by price for Tomter
Human Development Index (HDI)
Statistic composite index of life expectancy, education, and per capita income.
Tomter CO2 Emissions
Carbon Dioxide (CO2) Emissions Per Capita in Tonnes Per Year
| Location | CO2 Emissions | CO2 Emissions Per Capita | CO2 Emissions Intensity |
|---|---|---|---|
| Tomter | 8,667 tn | 18.17 tn | 10,667.1 tons/km² |
| Østfold | 4,265,336 tn | 14.68 tn | 841.5 tons/km² |
| Norway | 86,855,170 tn | 17.74 tn | 269.1 tons/km² |
| 2013 CO2 emissions (tonnes/year) | 8,667 tn |
| 2013 CO2 emissions (tonnes/year) per capita | 18.17 tn |
| 2013 CO2 emissions intensity (tonnes/km²/year) | 10,667.1 tons/km² |
Recent Nearby Earthquakes
Magnitude 3.0 and greater
| Date▼ | Time↕ | Magnitude↕ | Distance↕ | Depth↕ | Location↕ | Link |
|---|---|---|---|---|---|---|
| 4/7/04 | 8:53 AM | 3.4 | 97.7 km | 22,900 m | southern Norway | usgs.gov |
| 11/29/00 | 10:07 PM | 3.4 | 82.1 km | 10,000 m | Sweden | usgs.gov |
| 11/19/94 | 9:07 AM | 3.5 | 54.8 km | 10,000 m | southern Norway | usgs.gov |
| 11/27/93 | 6:57 PM | 3.1 | 83.4 km | 10,000 m | southern Norway | usgs.gov |
| 11/12/93 | 7:54 PM | 3.4 | 79.3 km | 10,000 m | Sweden | usgs.gov |
| 2/19/92 | 6:39 AM | 3.8 | 52.6 km | 10,000 m | southern Norway | usgs.gov |
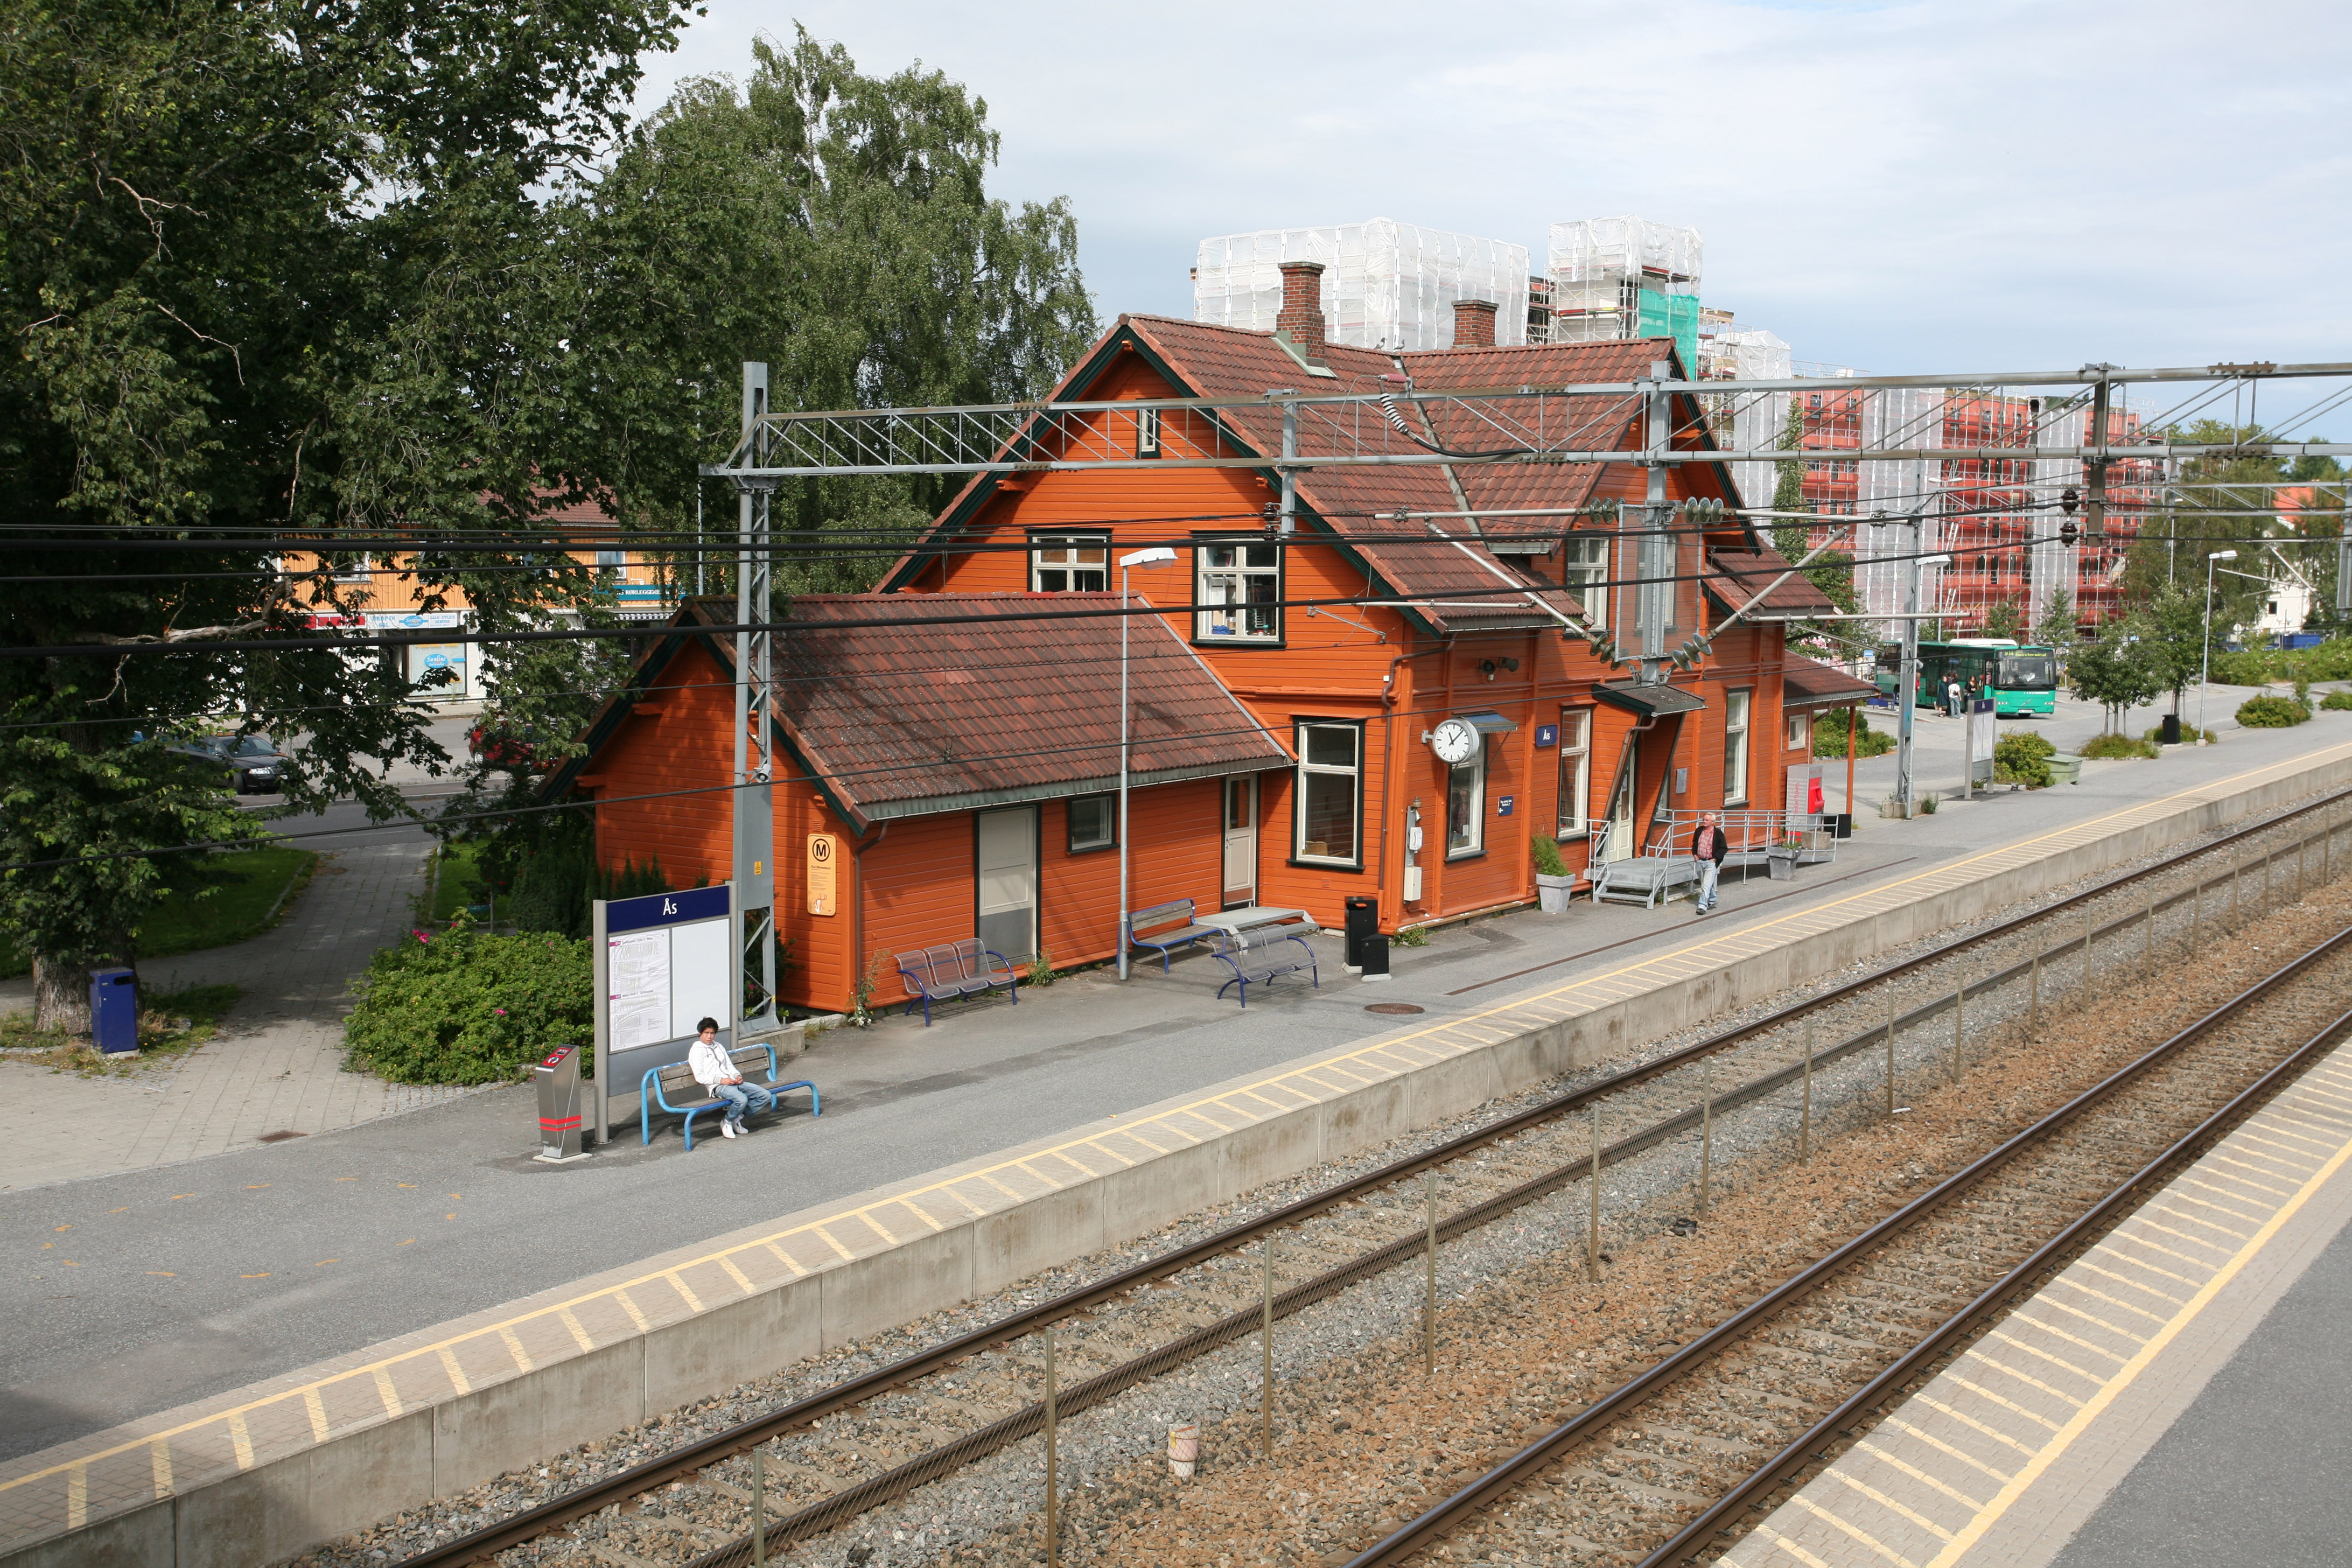
Tomter
Tomter is a village in the municipality of Hobøl, Norway. Its population (2014) is 1,668. It is the largest village in Hobøl, Knapstad is the second largest. has a railway station on Østre Linje, a part of Østfoldbanen.
Tomter Wikipedia Page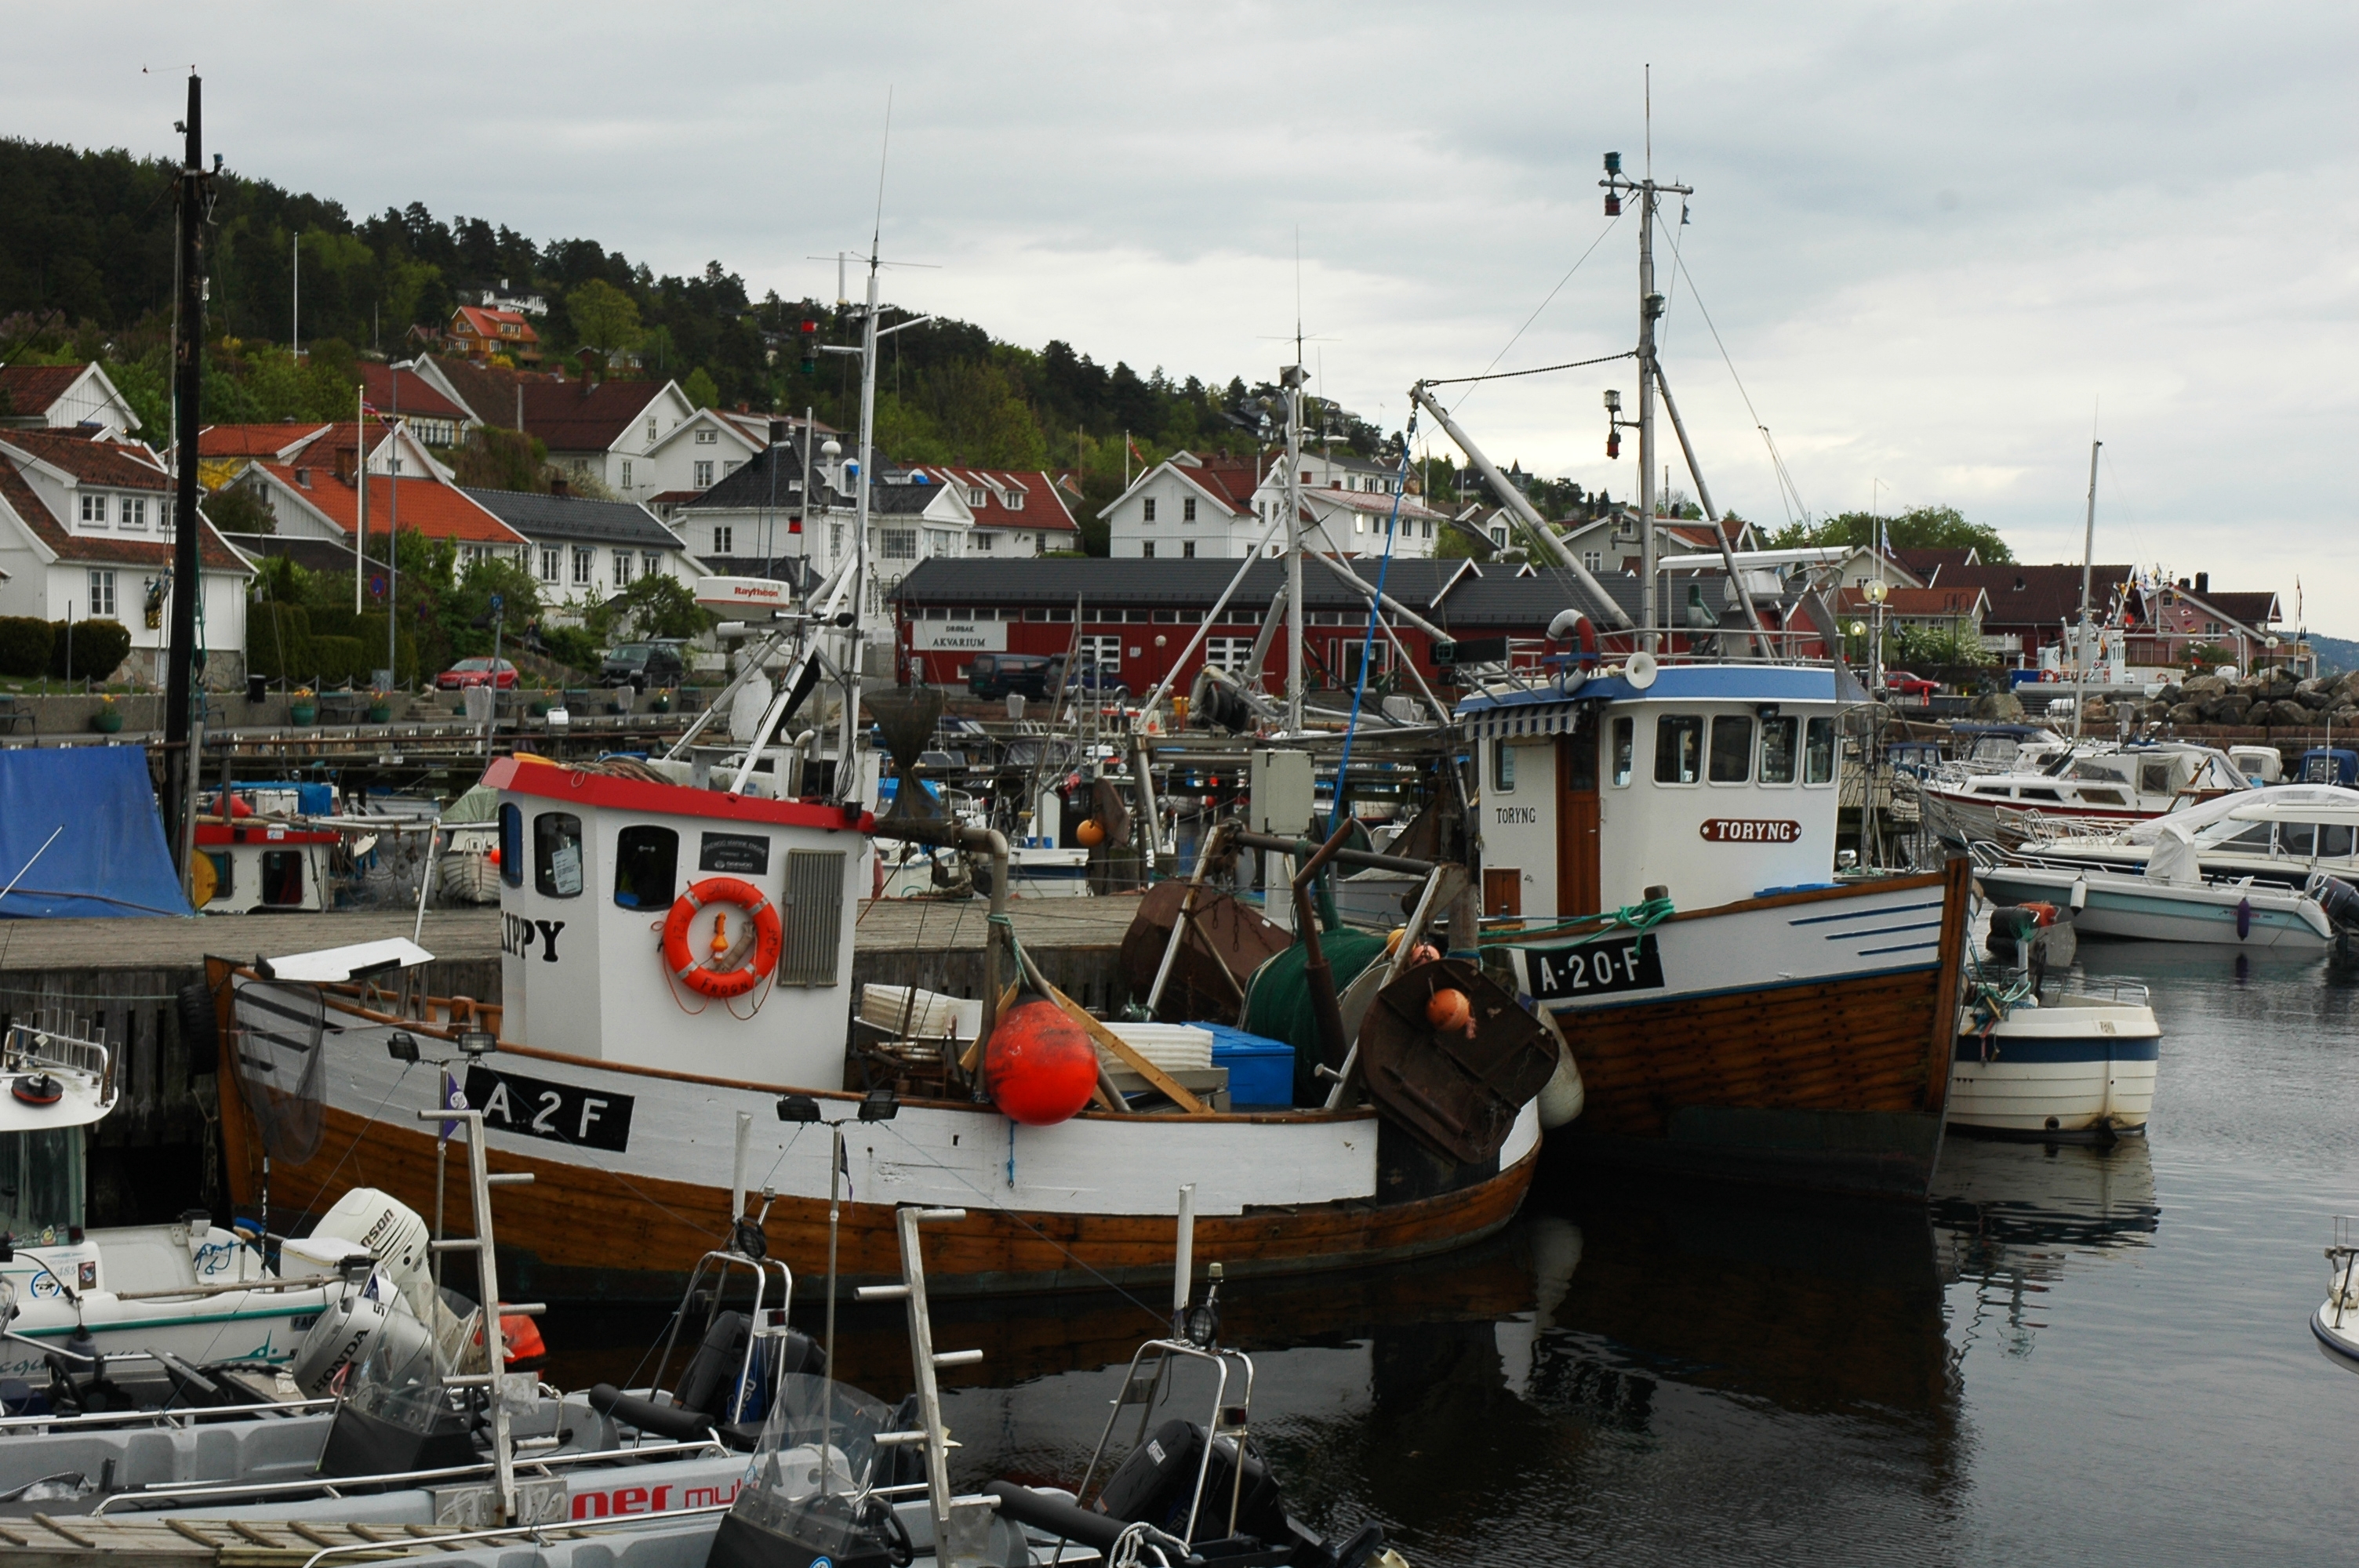
About Our Data
The data on this page is estimated using a number of publicly available tools and resources. It is provided without warranty, and could contain inaccuracies. Use at your own risk.