Categories in Torpo
Industries
Business Distribution by Industry in Torpo
| Industry Description | Number of Establishments |
|---|---|
| Unreachable | 49 |
| Construction of buildings | 19 |
| Buses and trains | 13 |
| Other transport activities | 11 |
| Beauty salons | 9 |
| Shopping | 8 |
| Car repair | 8 |
| Hardware store | 7 |
| Electrical installation | 7 |
| Other accommodation | 7 |
| Education | 7 |
Torpo Facts
| Area | 1.8 km² |
| Population | 111 |
| Population change (1975 to 2020) | -43.4% |
| Population change (2000 to 2020) | -27.0% |
| Local Time | |
| Timezone | Central European Summer Time |
| Lat & Lng | 60.66443, 8.71939 |
| Postal Codes | 3579 |
Map of Torpo
Interactive Map
Torpo Population
Years 1975 to 2020
| Data | 1975 | 1990 | 2000 | 2015 | 2020 |
|---|---|---|---|---|---|
| Population | 196 | 204 | 152 | 107 | 111 |
| Population Density | 112 / km² | 116.6 / km² | 86.9 / km² | 61.1 / km² | 63.4 / km² |
Torpo Population change from 2000 to 2015
Decrease of 29.6% from year 2000 to 2015
| Location | Change since 1975 | Change since 1990 | Change since 2000 |
|---|---|---|---|
| Torpo | -45.4% | -47.5% | -29.6% |
| Buskerud | +31.4% | +22.9% | +15.7% |
| Norway | +30.2% | +23.2% | +16.4% |
Torpo Population Density
Population Density: 63.4 / km²
| Location | Population | Area | Density |
|---|---|---|---|
| Torpo | 111 | 1.75 km² | 63.4 / km² |
| Buskerud | 276,719 | 15,054.4 km² | 18.4 / km² |
| Norway | 4.9 million | 322,754.2 km² | 15.2 / km² |
Torpo Historical and Projected Population
Estimated Population from 0 to 2100
- JRC (European Commission's Joint Research Centre) work on the GHS built-up grid
- CIESIN (Center for International Earth Science Information Network)
- [Link] Klein Goldewijk, K., Beusen, A., Doelman, J., and Stehfest, E.: Anthropogenic land use estimates for the Holocene – HYDE 3.2, Earth Syst. Sci. Data, 9, 927–953, https://doi.org/10.5194/essd-9-927-2017, 2017.
Area Codes
Percentage Area Codes used by businesses in Torpo
Postal Codes
Percentage of businesses by Postal Codes in Torpo
Price Distribution
Business distribution by price for Torpo
Human Development Index (HDI)
Statistic composite index of life expectancy, education, and per capita income.
Torpo CO2 Emissions
Carbon Dioxide (CO2) Emissions Per Capita in Tonnes Per Year
| Location | CO2 Emissions | CO2 Emissions Per Capita | CO2 Emissions Intensity |
|---|---|---|---|
| Torpo | 2,096 tn | 18.88 tn | 1,197.4 tons/km² |
| Buskerud | 5,164,730 tn | 18.66 tn | 343.1 tons/km² |
| Norway | 86,855,170 tn | 17.74 tn | 269.1 tons/km² |
| 2013 CO2 emissions (tonnes/year) | 2,096 tn |
| 2013 CO2 emissions (tonnes/year) per capita | 18.88 tn |
| 2013 CO2 emissions intensity (tonnes/km²/year) | 1,197.4 tons/km² |
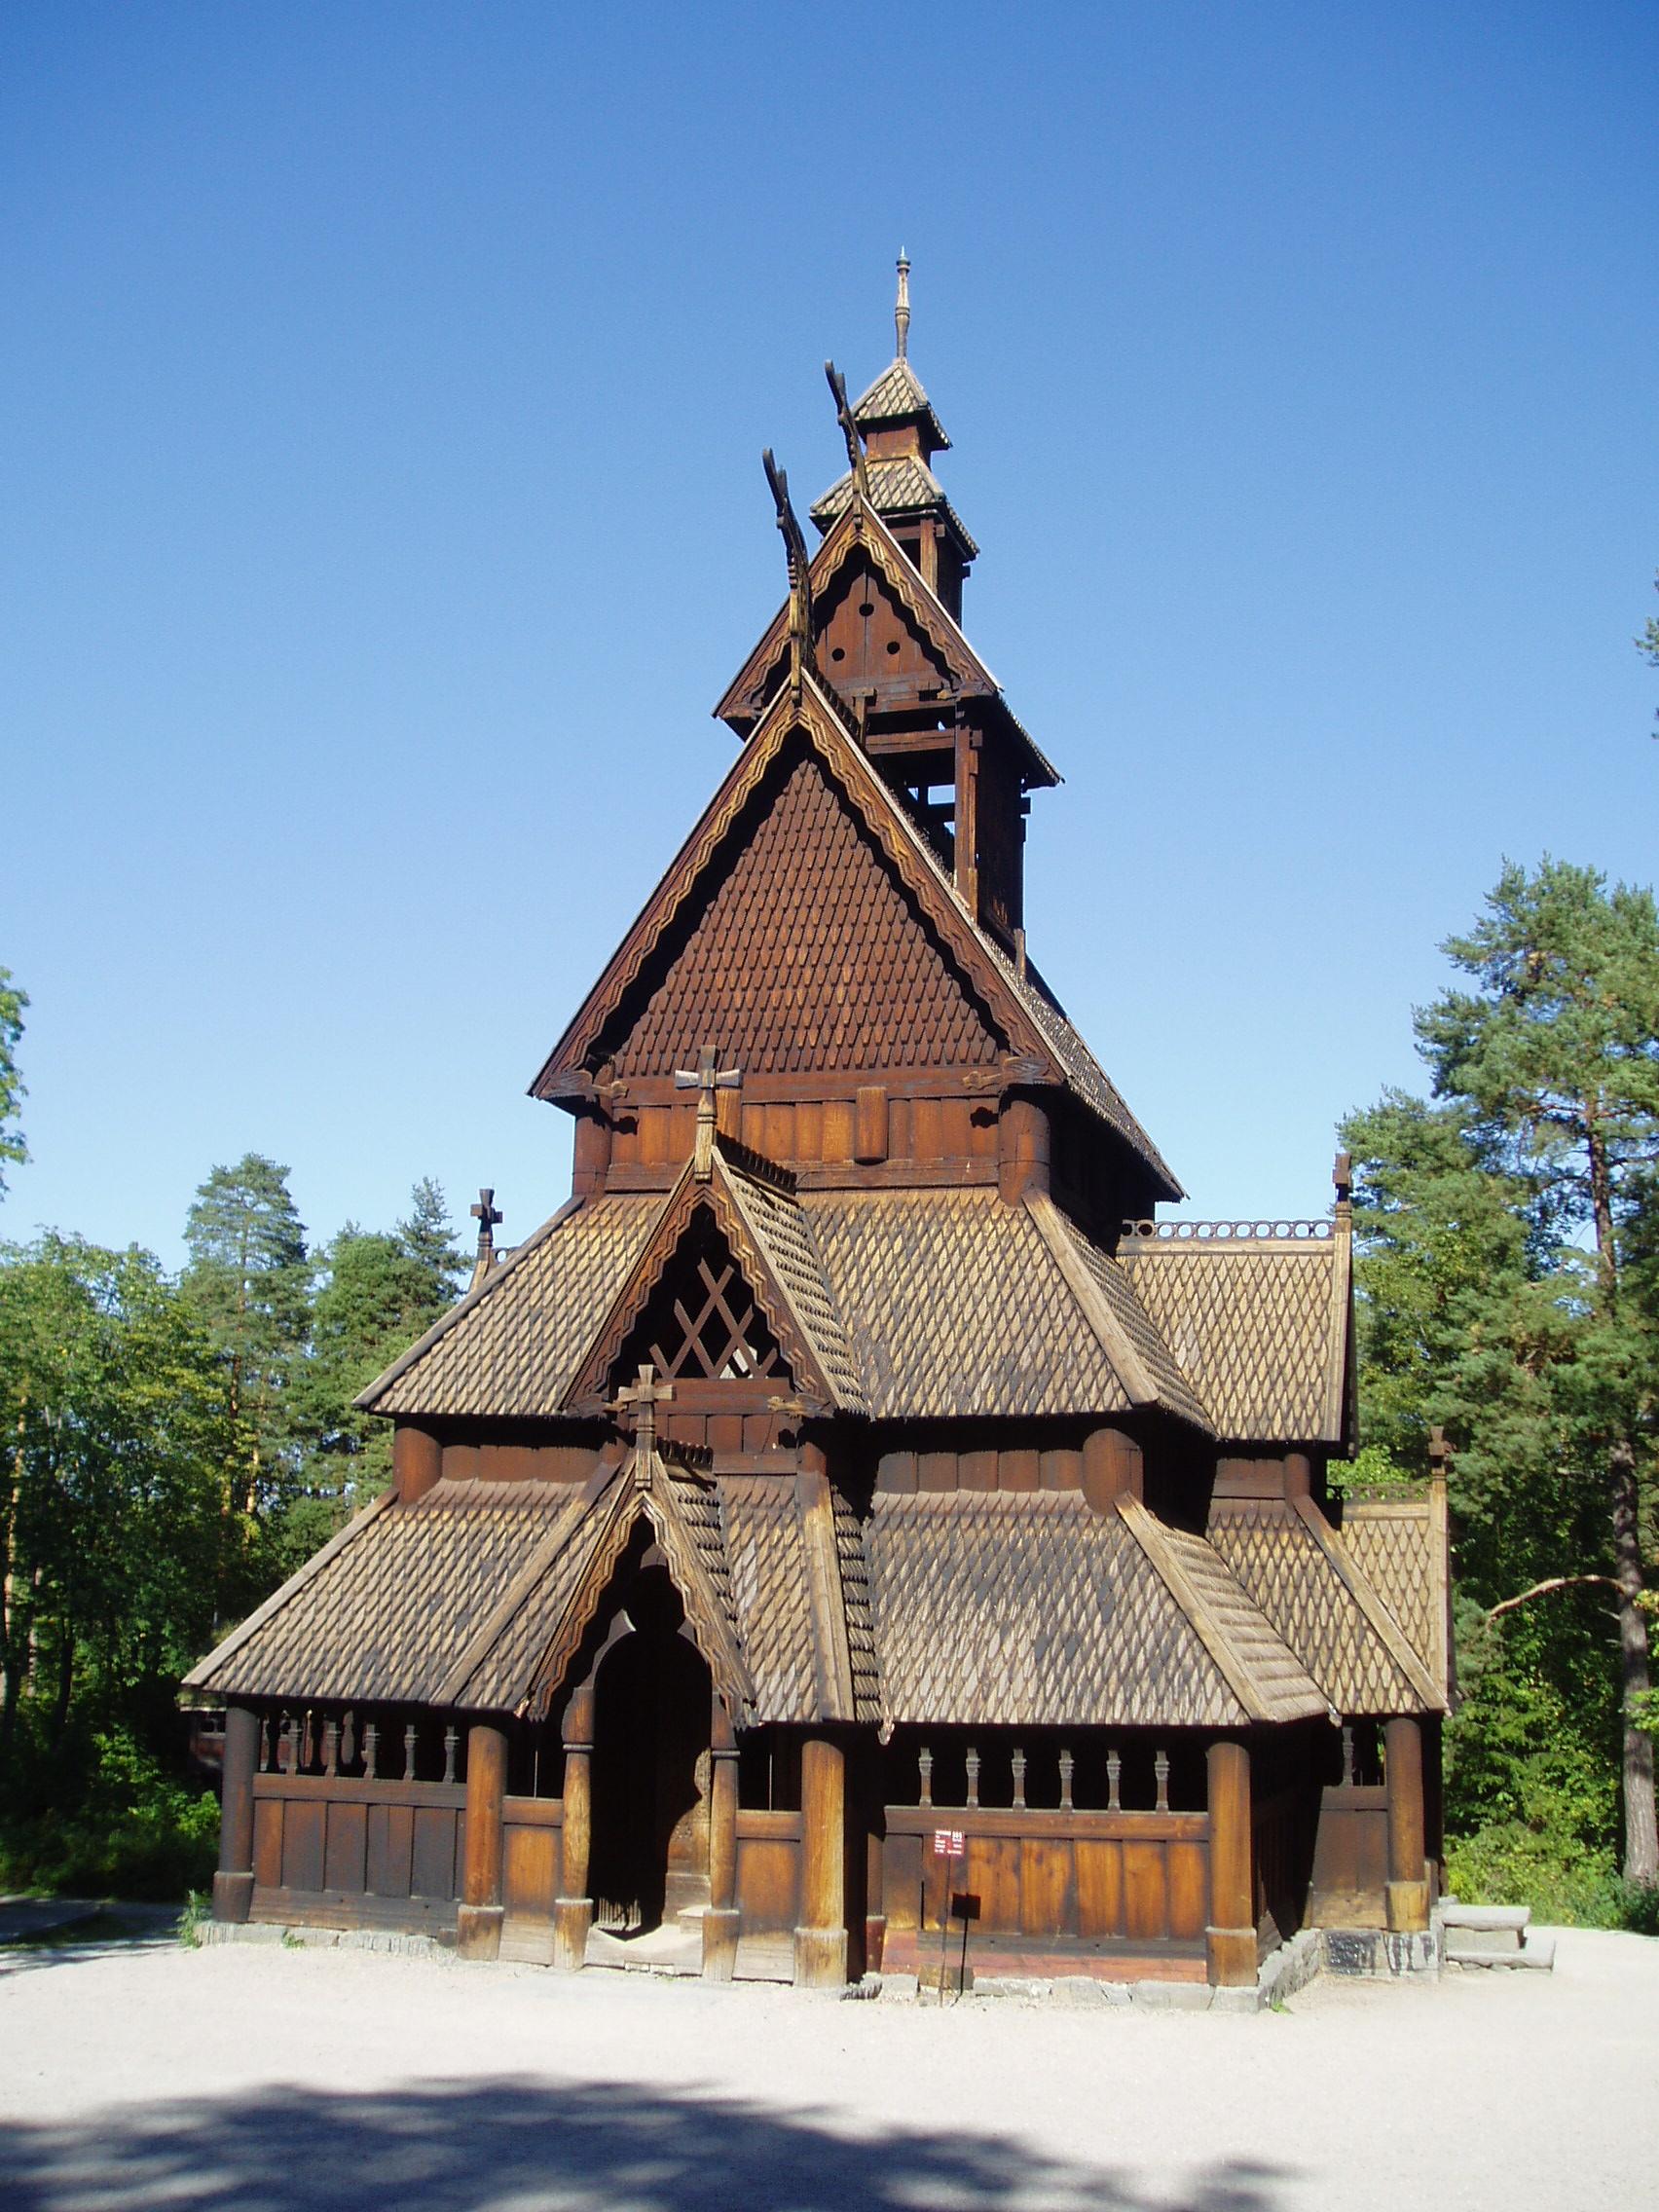
Torpo
Torpo is a small village in Ål municipality, in Buskerud County, Norway. Torpo is located in Hallingdal between the municipal centers of Ål and Gol. The village has 405 inhabitants per 1 January 2009. Previously Torpo was a stopover on the Bergen Rai..
Torpo Wikipedia Page


About Our Data
The data on this page is estimated using a number of publicly available tools and resources. It is provided without warranty, and could contain inaccuracies. Use at your own risk.