Categories in Vik, Buskerud
Industries
Business Distribution by Industry in Vik, Buskerud
| Industry Description | Number of Establishments | Average Age of Business |
|---|---|---|
| Unreachable | 57 | — |
| Construction of buildings | 49 | — |
| Buses and trains | 20 | — |
| Corporate management | 19 | 20 years |
| Education | 11 | — |
| Wholesalers | 10 | — |
| Shopping | 8 | — |
Map of Vik, Buskerud
Interactive Map
Vik, Buskerud Population
Years 1975 to 2020
| Data | 1975 | 1990 | 2000 | 2015 | 2020 |
|---|---|---|---|---|---|
| Population | 280 | 272 | 281 | 318 | 331 |
| Population Density | 248.9 / km² | 241.8 / km² | 249.8 / km² | 282.7 / km² | 294.2 / km² |
Vik, Buskerud Population change from 2000 to 2015
Increase of 13.2% from year 2000 to 2015
| Location | Change since 1975 | Change since 1990 | Change since 2000 |
|---|---|---|---|
| Vik, Buskerud | +13.6% | +16.9% | +13.2% |
| Buskerud | +31.4% | +22.9% | +15.7% |
| Norway | +30.2% | +23.2% | +16.4% |
Vik, Buskerud Population Density
Population Density: 294 / km²
| Location | Population | Area | Density |
|---|---|---|---|
| Vik, Buskerud | 331 | 1.125 km² | 294 / km² |
| Buskerud | 276,719 | 15,054.4 km² | 18.4 / km² |
| Norway | 4.9 million | 322,754.2 km² | 15.2 / km² |
Vik, Buskerud Historical and Projected Population
Estimated Population from 800 to 2100
- JRC (European Commission's Joint Research Centre) work on the GHS built-up grid
- CIESIN (Center for International Earth Science Information Network)
- [Link] Klein Goldewijk, K., Beusen, A., Doelman, J., and Stehfest, E.: Anthropogenic land use estimates for the Holocene – HYDE 3.2, Earth Syst. Sci. Data, 9, 927–953, https://doi.org/10.5194/essd-9-927-2017, 2017.
Human Development Index (HDI)
Statistic composite index of life expectancy, education, and per capita income.
Vik, Buskerud CO2 Emissions
Carbon Dioxide (CO2) Emissions Per Capita in Tonnes Per Year
| Location | CO2 Emissions | CO2 Emissions Per Capita | CO2 Emissions Intensity |
|---|---|---|---|
| Vik, Buskerud | 6,249 tn | 18.88 tn | 5,554.5 tons/km² |
| Buskerud | 5,164,730 tn | 18.66 tn | 343.1 tons/km² |
| Norway | 86,855,170 tn | 17.74 tn | 269.1 tons/km² |
| 2013 CO2 emissions (tonnes/year) | 6,249 tn |
| 2013 CO2 emissions (tonnes/year) per capita | 18.88 tn |
| 2013 CO2 emissions intensity (tonnes/km²/year) | 5,554.5 tons/km² |
Recent Nearby Earthquakes
Magnitude 3.0 and greater
| Date▼ | Time↕ | Magnitude↕ | Distance↕ | Depth↕ | Location↕ | Link |
|---|---|---|---|---|---|---|
| 4/7/04 | 8:53 AM | 3.4 | 82.4 km | 22,900 m | southern Norway | usgs.gov |
| 11/19/94 | 9:07 AM | 3.5 | 50 km | 10,000 m | southern Norway | usgs.gov |
| 11/27/93 | 6:57 PM | 3.1 | 73.7 km | 10,000 m | southern Norway | usgs.gov |
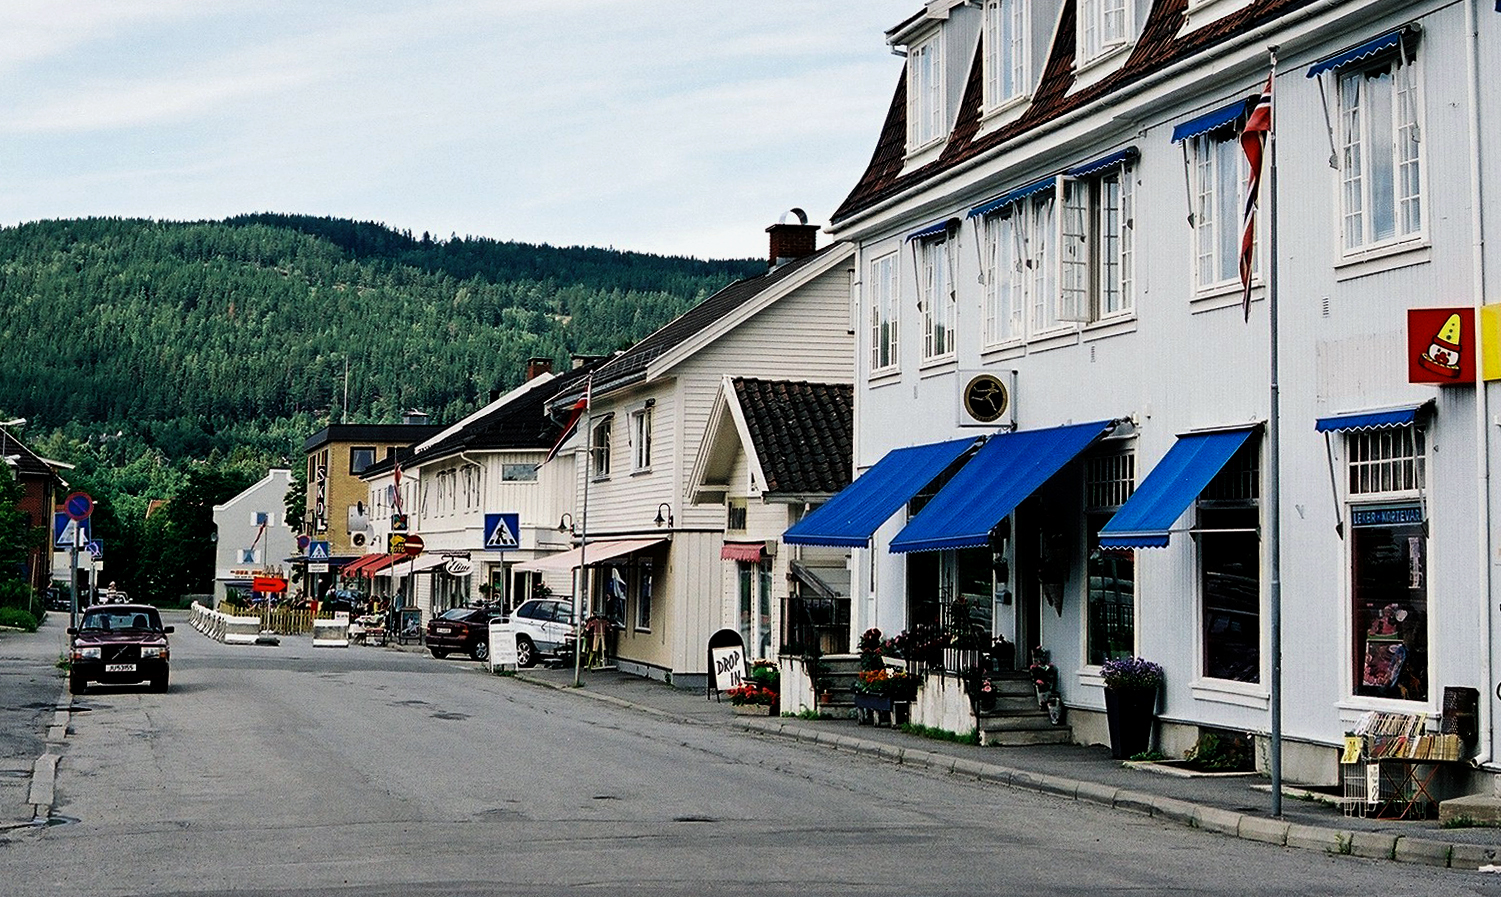
Vik, Buskerud
Vik is a village and the administrative center of Hole in Buskerud, Norway. is situated on the northeastern arm of Steinsfjorden, a branch of the Tyrifjorden. It is located on E16 between Sundvollen and Kroksund. The administration buildings for Ho..
Vik, Buskerud Wikipedia Page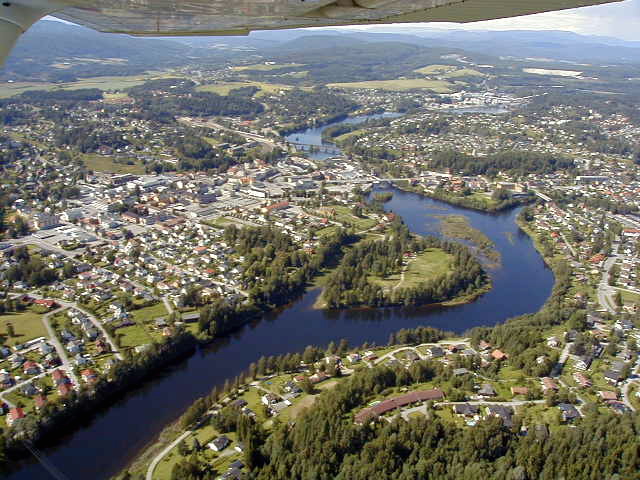

About Our Data
The data on this page is estimated using a number of publicly available tools and resources. It is provided without warranty, and could contain inaccuracies. Use at your own risk.