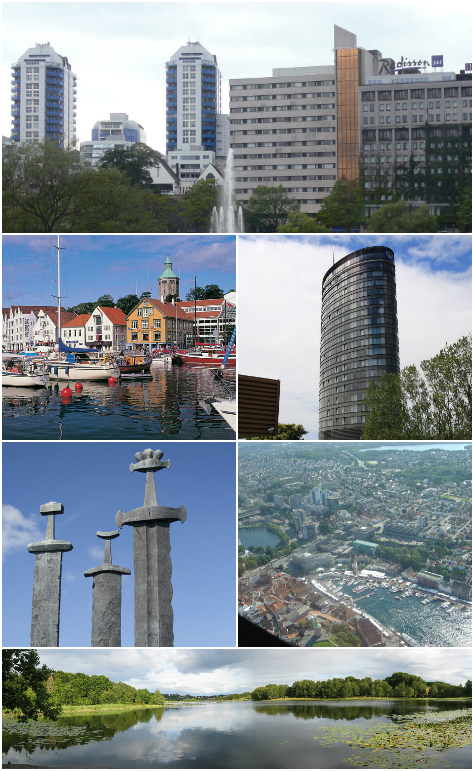
Categories in Vormedal
New car dealersImport Export CompanyIndustrial & Construction ManufacturingClothing storesWomen's clothingAssociation or OrganizationShipping and Mailing ServiceComputer ConsultantSoftware CompanyBathroom Supply StoreBuilding Materials StoreConstruction of buildingsContractorHome Goods StorePainting and paint contractorsTool StoreEducationMusic RelatedCafesGrocery stores and supermarketsPizzaRestaurantsFurniture storesInvestment CompanyHair SalonBack OfficeBusiness Management ConsultantBusiness to Business ServiceTemp AgencyReal Estate AgencyResidential Property RentalsShoppingGymPlaygroundSporting Goods StoreBus StationElectric Vehicle Charging StationTransportation logisticsTransportation ServiceTravel Agency
Industries
Business Distribution by Industry in Vormedal
| Industry Description | Number of Establishments | Average Age of Business |
|---|---|---|
| Construction of buildings | 34 | — |
| Clothing stores | 19 | — |
| Shopping | 17 | — |
| Buses and trains | 17 | — |
| Corporate management | 16 | 23 years |
| Electronics stores | 12 | — |
| Education | 9 | — |
| Restaurants | 9 | — |
| Real estate | 9 | — |
Vormedal Facts
| Area | 2.5 km² |
| Population | 1,481 |
| Male Population | 747 (50.4%) |
| Female Population | 734 (49.6%) |
| Population change (1975 to 2020) | +54.3% |
| Population change (2000 to 2020) | +20.2% |
| Median Age | 37.2 years (Male: 36.8, Female: 37.6) |
| Local Time | |
| Timezone | Central European Summer Time |
| Lat & Lng | 59.35607, 5.31962 |
| Postal Codes | 5542, 5544, 5545 |
Map of Vormedal
Interactive Map
Vormedal Population
Years 1975 to 2020
| Data | 1975 | 1990 | 2000 | 2015 | 2020 |
|---|---|---|---|---|---|
| Population | 960 | 1,110 | 1,232 | 1,392 | 1,481 |
| Population Density | 384 / km² | 444 / km² | 492.8 / km² | 556.8 / km² | 592.4 / km² |
Sources: JRC (European Commission's Joint Research Centre) work on the GHS built-up grid
Vormedal Population change from 2000 to 2015
Increase of 13% from year 2000 to 2015
| Location | Change since 1975 | Change since 1990 | Change since 2000 |
|---|---|---|---|
| Vormedal | +45% | +25.4% | +13% |
| Rogaland | +66.6% | +43% | +26.9% |
| Norway | +30.2% | +23.2% | +16.4% |
Sources: JRC (European Commission's Joint Research Centre) work on the GHS built-up grid
Vormedal Median Age
Median Age: 37.2 years
| Location | Median Age | Median Age (Female) | Median Age (Male) |
|---|---|---|---|
| Vormedal | 37.2 yrs | 37.6 yrs | 36.8 yrs |
| Rogaland | 35.9 yrs | 36.4 yrs | 35.3 yrs |
| Norway | 38.8 yrs | 39.6 yrs | 38 yrs |
Sources: CIESIN (Center for International Earth Science Information Network)
Vormedal Population Density
Population Density: 592 / km²
| Location | Population | Area | Density |
|---|---|---|---|
| Vormedal | 1,481 | 2.5 km² | 592 / km² |
| Rogaland | 472,447 | 16,531.3 km² | 28.6 / km² |
| Norway | 4.9 million | 322,754.2 km² | 15.2 / km² |
Sources: JRC (European Commission's Joint Research Centre) work on the GHS built-up grid
Vormedal Historical and Projected Population
Estimated Population from 1710 to 2100
Sources:
- JRC (European Commission's Joint Research Centre) work on the GHS built-up grid
- CIESIN (Center for International Earth Science Information Network)
- [Link] Klein Goldewijk, K., Beusen, A., Doelman, J., and Stehfest, E.: Anthropogenic land use estimates for the Holocene – HYDE 3.2, Earth Syst. Sci. Data, 9, 927–953, https://doi.org/10.5194/essd-9-927-2017, 2017.
Area Codes
Percentage Area Codes used by businesses in Vormedal
Human Development Index (HDI)
Statistic composite index of life expectancy, education, and per capita income.
Source: [Link] Kummu, M., Taka, M. &Guillaume, J. Gridded global datasets for Gross Domestic Product and Human Development Index over 1990–2015. Sci Data 5, 180004 (2018) doi:10.1038/sdata.2018.4
Vormedal CO2 Emissions
Carbon Dioxide (CO2) Emissions Per Capita in Tonnes Per Year
| Location | CO2 Emissions | CO2 Emissions Per Capita | CO2 Emissions Intensity |
|---|---|---|---|
| Vormedal | 26,918 tn | 18.18 tn | 10,767.3 tons/km² |
| Rogaland | 5,201,816 tn | 11.01 tn | 314.7 tons/km² |
| Norway | 86,855,170 tn | 17.74 tn | 269.1 tons/km² |
Sources: [Link] Moran, D., Kanemoto K; Jiborn, M., Wood, R., Többen, J., and Seto, K.C. (2018) Carbon footprints of 13,000 cities. Environmental Research Letters DOI: 10.1088/1748-9326/aac72a
Vormedal CO2 Emissions
| 2013 CO2 emissions (tonnes/year) | 26,918 tn |
| 2013 CO2 emissions (tonnes/year) per capita | 18.18 tn |
| 2013 CO2 emissions intensity (tonnes/km²/year) | 10,767.3 tons/km² |
Natural Hazards Risk
Relative risk out of 10
| Hazard | Risk Level |
|---|---|
| Earthquake | Low (2) |
* Risk, particularly concerning flood or landslide, may not be for the entire area.
Sources:
- Dilley, M., R.S. Chen, U. Deichmann, A.L. Lerner-Lam, M. Arnold, J. Agwe, P. Buys, O. Kjekstad, B. Lyon, and G. Yetman. 2005. Natural Disaster Hotspots: A Global Risk Analysis. Washington, D.C.: World Bank. https://doi.org/10.1596/0-8213-5930-4.
- Center for Hazards and Risk Research - CHRR - Columbia University, Center for International Earth Science Information Network - CIESIN - Columbia University. 2005. Global Earthquake Hazard Distribution - Peak Ground Acceleration. Palisades, NY: NASA Socioeconomic Data and Applications Center (SEDAC). https://doi.org/10.7927/H4BZ63ZS.
Recent Nearby Earthquakes
Magnitude 3.0 and greater
| Date▼ | Time↕ | Magnitude↕ | Distance↕ | Depth↕ | Location↕ | Link |
|---|---|---|---|---|---|---|
| 3/14/12 | 7:22 PM | 3.6 | 25.6 km | 6,200 m | southern Norway | usgs.gov |
| 5/25/07 | 9:54 AM | 3.2 | 60.6 km | 0 m | southern Norway | usgs.gov |
| 12/8/00 | 12:48 AM | 3.6 | 82.2 km | 10,000 m | southern Norway | usgs.gov |
| 8/12/00 | 2:27 PM | 4.1 | 25.8 km | 10,000 m | southern Norway | usgs.gov |
| 8/6/92 | 7:32 AM | 3.7 | 65.9 km | 33,000 m | southern Norway | usgs.gov |
| 4/14/92 | 1:10 PM | 3.7 | 29.8 km | 10,000 m | southern Norway | usgs.gov |
| 10/28/91 | 1:14 PM | 3 | 77.1 km | 10,000 m | southern Norway | usgs.gov |
| 8/23/91 | 4:07 AM | 3.1 | 46.8 km | 10,000 m | southern Norway | usgs.gov |
| 2/25/90 | 10:00 AM | 3 | 62.7 km | 10,000 m | southern Norway | usgs.gov |
| 1/29/89 | 4:38 PM | 4.8 | 37.1 km | 10,000 m | southern Norway | usgs.gov |
Source: U.S. Geological Survey (USGS)

About Our Data
The data on this page is estimated using a number of publicly available tools and resources. It is provided without warranty, and could contain inaccuracies. Use at your own risk.