Bhadsar Facts
| Area | 2.3 km² |
| Population | 4,140 |
| Male Population | 2,113 (51.0%) |
| Female Population | 2,027 (49.0%) |
| Population change (1975 to 2020) | +1871.4% |
| Population change (2000 to 2020) | +30.0% |
| Median Age | 19.4 years (Male: 19, Female: 20) |
| Local Time | |
| Timezone | Nepal Time |
| Lat & Lng | 26.81894, 85.52333 |
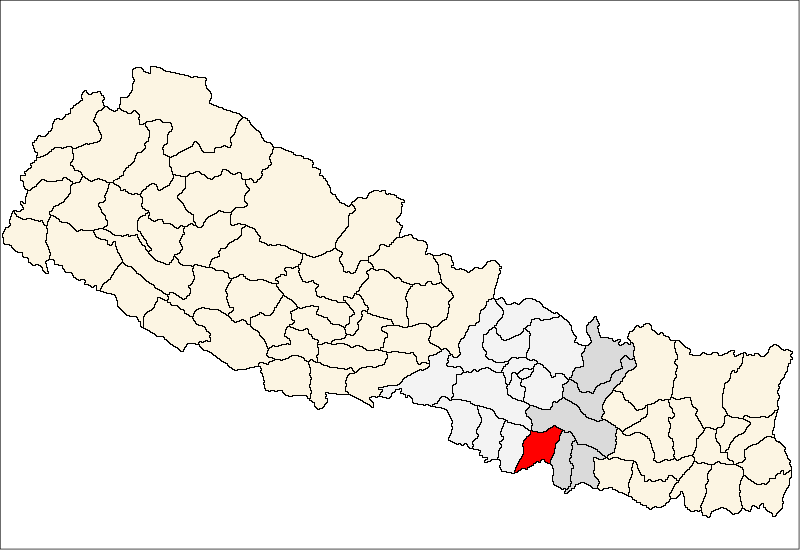
Map of Bhadsar
Interactive Map
Bhadsar Population
Years 1975 to 2020
| Data | 1975 | 1990 | 2000 | 2015 | 2020 |
|---|---|---|---|---|---|
| Population | 210 | 1,590 | 3,185 | 3,855 | 4,140 |
| Population Density | 90.8 / km² | 687.6 / km² | 1,377.3 / km² | 1,667 / km² | 1,790.3 / km² |
Bhadsar Population change from 2000 to 2015
Increase of 21% from year 2000 to 2015
| Location | Change since 1975 | Change since 1990 | Change since 2000 |
|---|---|---|---|
| Bhadsar | +1735.7% | +142.5% | +21% |
| Nepal | +115.2% | +52.2% | +20.2% |
Bhadsar Median Age
Median Age: 19.4 years
| Location | Median Age | Median Age (Female) | Median Age (Male) |
|---|---|---|---|
| Bhadsar | 19.4 yrs | 20 yrs | 19 yrs |
| Nepal | 21.7 yrs | 22.6 yrs | 20.4 yrs |
Bhadsar Population Density
Population Density: 1,790 / km²
| Location | Population | Area | Density |
|---|---|---|---|
| Bhadsar | 4,140 | 2.313 km² | 1,790 / km² |
| Nepal | 28.7 million | 147,926.4 km² | 194 / km² |
Bhadsar Historical and Projected Population
Estimated Population from 1890 to 2100
- JRC (European Commission's Joint Research Centre) work on the GHS built-up grid
- CIESIN (Center for International Earth Science Information Network)
- [Link] Klein Goldewijk, K., Beusen, A., Doelman, J., and Stehfest, E.: Anthropogenic land use estimates for the Holocene – HYDE 3.2, Earth Syst. Sci. Data, 9, 927–953, https://doi.org/10.5194/essd-9-927-2017, 2017.
Human Development Index (HDI)
Statistic composite index of life expectancy, education, and per capita income.
Bhadsar CO2 Emissions
Carbon Dioxide (CO2) Emissions Per Capita in Tonnes Per Year
| Location | CO2 Emissions | CO2 Emissions Per Capita | CO2 Emissions Intensity |
|---|---|---|---|
| Bhadsar | 3,329 tn | 0.8 tn | 1,439.5 tons/km² |
| Nepal | 11,136,221 tn | 0.39 tn | 75.3 tons/km² |
| 2013 CO2 emissions (tonnes/year) | 3,329 tn |
| 2013 CO2 emissions (tonnes/year) per capita | 0.8 tn |
| 2013 CO2 emissions intensity (tonnes/km²/year) | 1,439.5 tons/km² |
Natural Hazards Risk
Relative risk out of 10
| Hazard | Risk Level |
|---|---|
| Drought | Medium (5) |
| Flood | High (10) |
| Earthquake | Medium (7) |
* Risk, particularly concerning flood or landslide, may not be for the entire area.
- Dilley, M., R.S. Chen, U. Deichmann, A.L. Lerner-Lam, M. Arnold, J. Agwe, P. Buys, O. Kjekstad, B. Lyon, and G. Yetman. 2005. Natural Disaster Hotspots: A Global Risk Analysis. Washington, D.C.: World Bank. https://doi.org/10.1596/0-8213-5930-4.
- Center for Hazards and Risk Research - CHRR - Columbia University, Center for International Earth Science Information Network - CIESIN - Columbia University, and International Research Institute for Climate and Society - IRI - Columbia University. 2005. Global Drought Hazard Frequency and Distribution. Palisades, NY: NASA Socioeconomic Data and Applications Center (SEDAC). https://doi.org/10.7927/H4VX0DFT.
- Center for Hazards and Risk Research - CHRR - Columbia University, Center for International Earth Science Information Network - CIESIN - Columbia University. 2005. Global Flood Hazard Frequency and Distribution. Palisades, NY: NASA Socioeconomic Data and Applications Center (SEDAC). https://doi.org/10.7927/H4668B3D.
- Center for Hazards and Risk Research - CHRR - Columbia University, Center for International Earth Science Information Network - CIESIN - Columbia University. 2005. Global Earthquake Hazard Distribution - Peak Ground Acceleration. Palisades, NY: NASA Socioeconomic Data and Applications Center (SEDAC). https://doi.org/10.7927/H4BZ63ZS.
Recent Nearby Earthquakes
Magnitude 3.0 and greater
| Date▼ | Time↕ | Magnitude↕ | Distance↕ | Depth↕ | Location↕ | Link |
|---|---|---|---|---|---|---|
| 7/2/17 | 1:58 AM | 4.8 | 75 km | 10,000 m | 10km SSE of Ramechhap, Nepal | usgs.gov |
| 2/27/17 | 4:21 AM | 4.6 | 73.3 km | 20,280 m | 16km WNW of Ramechhap, Nepal | usgs.gov |
| 2/27/17 | 3:37 AM | 4.7 | 86.9 km | 11,230 m | 11km N of Ramechhap, Nepal | usgs.gov |
| 4/9/16 | 1:20 PM | 4.1 | 93.1 km | 10,220 m | 4km SSW of Patan, Nepal | usgs.gov |
| 4/4/16 | 4:31 AM | 4.2 | 85.6 km | 23,690 m | 32km E of Panaoti, Nepal | usgs.gov |
| 2/10/16 | 4:27 PM | 4.1 | 99.5 km | 21,150 m | 10km E of Nagarkot, Nepal | usgs.gov |
| 8/30/15 | 1:17 PM | 4.5 | 93.4 km | 10,000 m | 14km E of Banepa, Nepal | usgs.gov |
| 8/11/15 | 4:57 AM | 3.7 | 95.7 km | 2,640 m | 2km SE of Patan, Nepal | usgs.gov |
| 6/29/15 | 9:46 PM | 4.3 | 75.9 km | 10,000 m | 26km ESE of Panaoti, Nepal | usgs.gov |
| 6/22/15 | 7:34 AM | 4.3 | 92.4 km | 10,000 m | 25km NNW of Ramechhap, Nepal | usgs.gov |
Bhadsar
Bhadsar is a village development committee in Sarlahi District in the Janakpur Zone of south-eastern Nepal. At the time of the 1991 Nepal census it had a population of 2950 people living in 499 individual households.
Bhadsar Wikipedia Page
About Our Data
The data on this page is estimated using a number of publicly available tools and resources. It is provided without warranty, and could contain inaccuracies. Use at your own risk.