Categories in Ilo
Industries
Business Distribution by Industry in Ilo
| Industry Description | Number of Establishments |
|---|---|
| Restaurants | 296 |
| Shopping | 167 |
| Education | 90 |
| Corporate management | 90 |
| Hotels and motels | 83 |
| Other accommodation | 76 |
| Clothing stores | 73 |
| Grocery stores and supermarkets | 68 |
| Public parks | 61 |
| Electronics stores | 54 |
| Car repair | 50 |
| Bars, pubs and taverns | 47 |
| Hardware store | 47 |
| Public administration | 46 |
Ilo Facts
| Area | 249.9 km² |
| Population | 67,867 |
| Male Population | 34,472 (50.8%) |
| Female Population | 33,395 (49.2%) |
| Population change (1975 to 2020) | +236.6% |
| Population change (2000 to 2020) | +29.1% |
| Median Age | 28.1 years (Male: 28.2, Female: 27.9) |
| Neighborhoods | Pampa Inalámbrica, El Puerto, Pueblo Nuevo, Miramar, Villa del Mar |
| Local Time | |
| Timezone | Peru Standard Time |
| Lat & Lng | -17.63944, -71.33750 |
| Postal Codes | 18601 |
Map of Ilo
Interactive Map
Ilo Population
Years 1975 to 2020
| Data | 1975 | 1990 | 2000 | 2015 | 2020 |
|---|---|---|---|---|---|
| Population | 20,160 | 40,521 | 52,581 | 65,320 | 67,867 |
| Population Density | 80.7 / km² | 162.1 / km² | 210.4 / km² | 261.3 / km² | 271.5 / km² |
Ilo Population change from 2000 to 2015
Increase of 24.2% from year 2000 to 2015
| Location | Change since 1975 | Change since 1990 | Change since 2000 |
|---|---|---|---|
| Ilo | +224% | +61.2% | +24.2% |
| Moquegua Region | +115.9% | +45.8% | +19.6% |
| Peru | +104.4% | +42.6% | +20.2% |
Ilo Median Age
Median Age: 28.1 years
| Location | Median Age | Median Age (Female) | Median Age (Male) |
|---|---|---|---|
| Ilo | 28.1 yrs | 27.9 yrs | 28.2 yrs |
| Moquegua Region | 28.7 yrs | 28.5 yrs | 28.9 yrs |
| Peru | 25.1 yrs | 25.6 yrs | 24.6 yrs |
Ilo Population Density
Population Density: 272 / km²
| Location | Population | Area | Density |
|---|---|---|---|
| Ilo | 67,867 | 249.9 km² | 272 / km² |
| Moquegua Region | 175,549 | 15,745.8 km² | 11.1 / km² |
| Peru | 31 million | 1,291,975 km² | 24 / km² |
Ilo Historical and Projected Population
Estimated Population from 0 to 2100
- JRC (European Commission's Joint Research Centre) work on the GHS built-up grid
- CIESIN (Center for International Earth Science Information Network)
- [Link] Klein Goldewijk, K., Beusen, A., Doelman, J., and Stehfest, E.: Anthropogenic land use estimates for the Holocene – HYDE 3.2, Earth Syst. Sci. Data, 9, 927–953, https://doi.org/10.5194/essd-9-927-2017, 2017.
Neighborhoods in Ilo
Percentage of businesses by neighborhood in Ilo
Area Codes
Percentage Area Codes used by businesses in Ilo
Price Distribution
Business distribution by price for Ilo
Human Development Index (HDI)
Statistic composite index of life expectancy, education, and per capita income.
Ilo CO2 Emissions
Carbon Dioxide (CO2) Emissions Per Capita in Tonnes Per Year
| Location | CO2 Emissions | CO2 Emissions Per Capita | CO2 Emissions Intensity |
|---|---|---|---|
| Ilo | 172,038 tn | 2.53 tn | 688.3 tons/km² |
| Moquegua Region | 510,403 tn | 2.91 tn | 32.4 tons/km² |
| Peru | 71,626,946 tn | 2.31 tn | 55.4 tons/km² |
| 2013 CO2 emissions (tonnes/year) | 172,038 tn |
| 2013 CO2 emissions (tonnes/year) per capita | 2.53 tn |
| 2013 CO2 emissions intensity (tonnes/km²/year) | 688.3 tons/km² |
Natural Hazards Risk
Relative risk out of 10
| Hazard | Risk Level |
|---|---|
| Flood | Medium (4) |
| Earthquake | High (8.7) |
* Risk, particularly concerning flood or landslide, may not be for the entire area.
- Dilley, M., R.S. Chen, U. Deichmann, A.L. Lerner-Lam, M. Arnold, J. Agwe, P. Buys, O. Kjekstad, B. Lyon, and G. Yetman. 2005. Natural Disaster Hotspots: A Global Risk Analysis. Washington, D.C.: World Bank. https://doi.org/10.1596/0-8213-5930-4.
- Center for Hazards and Risk Research - CHRR - Columbia University, Center for International Earth Science Information Network - CIESIN - Columbia University. 2005. Global Flood Hazard Frequency and Distribution. Palisades, NY: NASA Socioeconomic Data and Applications Center (SEDAC). https://doi.org/10.7927/H4668B3D.
- Center for Hazards and Risk Research - CHRR - Columbia University, Center for International Earth Science Information Network - CIESIN - Columbia University. 2005. Global Earthquake Hazard Distribution - Peak Ground Acceleration. Palisades, NY: NASA Socioeconomic Data and Applications Center (SEDAC). https://doi.org/10.7927/H4BZ63ZS.
Recent Nearby Earthquakes
Magnitude 3.0 and greater
| Date▼ | Time↕ | Magnitude↕ | Distance↕ | Depth↕ | Location↕ | Link |
|---|---|---|---|---|---|---|
| 9/26/18 | 2:46 PM | 4 | 10.5 km | 56,550 m | 10km S of Ilo, Peru | usgs.gov |
| 4/13/18 | 3:11 PM | 4.1 | 34.3 km | 77,940 m | 28km NNE of Pacocha, Peru | usgs.gov |
| 3/15/18 | 5:05 AM | 4.2 | 44.8 km | 62,260 m | 25km WSW of Moquegua, Peru | usgs.gov |
| 12/31/16 | 4:27 AM | 4.2 | 2.9 km | 69,120 m | 2km NNW of Ilo, Peru | usgs.gov |
| 11/10/16 | 3:14 AM | 4.1 | 47.5 km | 69,980 m | 35km ESE of Cocachacra, Peru | usgs.gov |
| 10/19/16 | 6:14 PM | 3.9 | 37.4 km | 85,970 m | 31km N of Pacocha, Peru | usgs.gov |
| 6/21/16 | 10:25 AM | 4.3 | 22.1 km | 35,000 m | 20km W of Pacocha, Peru | usgs.gov |
| 3/10/16 | 4:22 PM | 3.9 | 22.2 km | 53,600 m | 22km W of Ilo, Peru | usgs.gov |
| 3/20/15 | 8:49 AM | 4 | 32.8 km | 28,000 m | 32km WSW of Ilo, Peru | usgs.gov |
| 5/16/14 | 1:05 AM | 4.2 | 25 km | 54,000 m | 20km NW of Pacocha, Peru | usgs.gov |
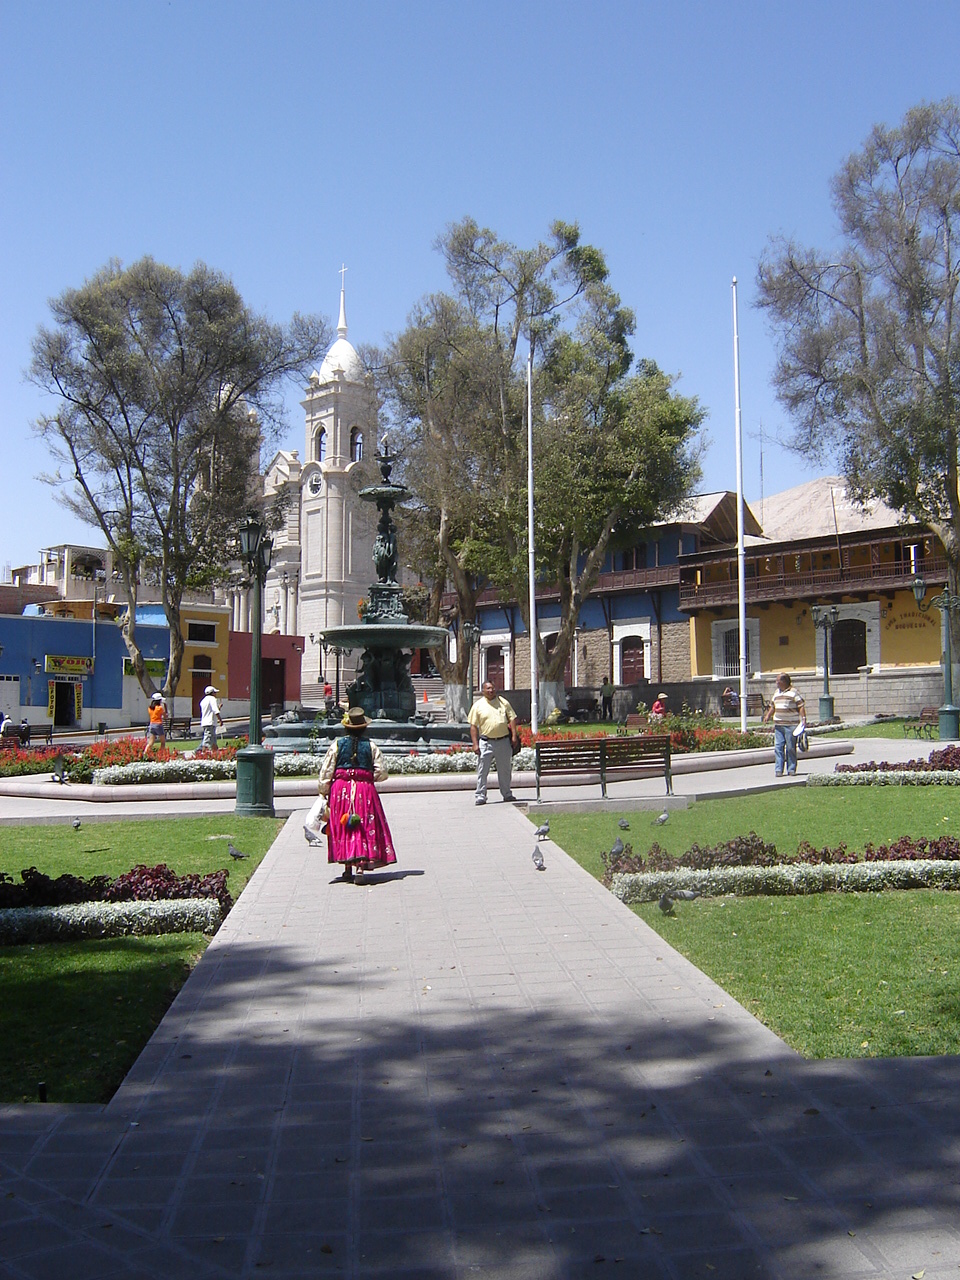
Ilo
Ilo is a port city in southern Peru, with some 67,000 inhabitants. It is the second city in the Moquegua Region and capital of the Ilo Province.
Ilo Wikipedia Page

About Our Data
The data on this page is estimated using a number of publicly available tools and resources. It is provided without warranty, and could contain inaccuracies. Use at your own risk.