Categories in Jauja
Industries
Business Distribution by Industry in Jauja
| Industry Description | Number of Establishments |
|---|---|
| Restaurants | 97 |
| Shopping | 45 |
| Education | 39 |
| Hotels and motels | 30 |
| Travel agencies | 25 |
| Public parks | 24 |
| Pharmacies and drug stores | 23 |
| Public administration | 22 |
| Churches | 18 |
| Electronics stores | 18 |
Jauja Facts
| Area | 7.8 km² |
| Population | 16,155 |
| Male Population | 7,855 (48.6%) |
| Female Population | 8,300 (51.4%) |
| Population change (1975 to 2020) | -18.6% |
| Population change (2000 to 2020) | -17.3% |
| Median Age | 26.1 years (Male: 24.3, Female: 27.9) |
| Neighborhoods | Zona Monumental Jauja, Centro Urbano de Pucallpa |
| Local Time | |
| Timezone | Peru Standard Time |
| Lat & Lng | -11.77584, -75.49656 |
| Postal Codes | 12600, 12601, 12615, 12800 |
Map of Jauja
Interactive Map
Jauja Population
Years 1975 to 2020
| Data | 1975 | 1990 | 2000 | 2015 | 2020 |
|---|---|---|---|---|---|
| Population | 19,835 | 21,015 | 19,540 | 15,421 | 16,155 |
| Population Density | 2,559.4 / km² | 2,711.6 / km² | 2,521.3 / km² | 1,989.8 / km² | 2,084.5 / km² |
Jauja Population change from 2000 to 2015
Decrease of 21.1% from year 2000 to 2015
| Location | Change since 1975 | Change since 1990 | Change since 2000 |
|---|---|---|---|
| Jauja | -22.3% | -26.6% | -21.1% |
| Junín Region | +71.4% | +33.1% | +18.8% |
| Peru | +104.4% | +42.6% | +20.2% |
Jauja Median Age
Median Age: 26.1 years
| Location | Median Age | Median Age (Female) | Median Age (Male) |
|---|---|---|---|
| Jauja | 26.1 yrs | 27.9 yrs | 24.3 yrs |
| Junín Region | 23.4 yrs | 23.9 yrs | 22.8 yrs |
| Peru | 25.1 yrs | 25.6 yrs | 24.6 yrs |
Jauja Population Density
Population Density: 2,085 / km²
| Location | Population | Area | Density |
|---|---|---|---|
| Jauja | 16,155 | 7.8 km² | 2,085 / km² |
| Junín Region | 1.4 million | 44,295.5 km² | 31.4 / km² |
| Peru | 31 million | 1,291,975 km² | 24 / km² |
Jauja Historical and Projected Population
Estimated Population from 0 to 2100
- JRC (European Commission's Joint Research Centre) work on the GHS built-up grid
- CIESIN (Center for International Earth Science Information Network)
- [Link] Klein Goldewijk, K., Beusen, A., Doelman, J., and Stehfest, E.: Anthropogenic land use estimates for the Holocene – HYDE 3.2, Earth Syst. Sci. Data, 9, 927–953, https://doi.org/10.5194/essd-9-927-2017, 2017.
Area Codes
Percentage Area Codes used by businesses in Jauja
Price Distribution
Business distribution by price for Jauja
Human Development Index (HDI)
Statistic composite index of life expectancy, education, and per capita income.
Jauja CO2 Emissions
Carbon Dioxide (CO2) Emissions Per Capita in Tonnes Per Year
| Location | CO2 Emissions | CO2 Emissions Per Capita | CO2 Emissions Intensity |
|---|---|---|---|
| Jauja | 41,000 tn | 2.54 tn | 5,290.3 tons/km² |
| Junín Region | 3,208,952 tn | 2.31 tn | 72.4 tons/km² |
| Peru | 71,626,946 tn | 2.31 tn | 55.4 tons/km² |
| 2013 CO2 emissions (tonnes/year) | 41,000 tn |
| 2013 CO2 emissions (tonnes/year) per capita | 2.54 tn |
| 2013 CO2 emissions intensity (tonnes/km²/year) | 5,290.3 tons/km² |
Natural Hazards Risk
Relative risk out of 10
| Hazard | Risk Level |
|---|---|
| Flood | High (10) |
| Earthquake | Medium (7) |
| Landslide | Medium (6) |
* Risk, particularly concerning flood or landslide, may not be for the entire area.
- Dilley, M., R.S. Chen, U. Deichmann, A.L. Lerner-Lam, M. Arnold, J. Agwe, P. Buys, O. Kjekstad, B. Lyon, and G. Yetman. 2005. Natural Disaster Hotspots: A Global Risk Analysis. Washington, D.C.: World Bank. https://doi.org/10.1596/0-8213-5930-4.
- Center for Hazards and Risk Research - CHRR - Columbia University, Center for International Earth Science Information Network - CIESIN - Columbia University, and Norwegian Geotechnical Institute - NGI. 2005. Global Landslide Hazard Distribution. Palisades, NY: NASA Socioeconomic Data and Applications Center (SEDAC). https://doi.org/10.7927/H4P848VZ.
- Center for Hazards and Risk Research - CHRR - Columbia University, Center for International Earth Science Information Network - CIESIN - Columbia University. 2005. Global Flood Hazard Frequency and Distribution. Palisades, NY: NASA Socioeconomic Data and Applications Center (SEDAC). https://doi.org/10.7927/H4668B3D.
- Center for Hazards and Risk Research - CHRR - Columbia University, Center for International Earth Science Information Network - CIESIN - Columbia University. 2005. Global Earthquake Hazard Distribution - Peak Ground Acceleration. Palisades, NY: NASA Socioeconomic Data and Applications Center (SEDAC). https://doi.org/10.7927/H4BZ63ZS.
Recent Nearby Earthquakes
Magnitude 3.0 and greater
| Date▼ | Time↕ | Magnitude↕ | Distance↕ | Depth↕ | Location↕ | Link |
|---|---|---|---|---|---|---|
| 8/19/19 | 5:37 AM | 4.7 | 66.3 km | 10,000 m | 20km S of Huayucachi, Peru | usgs.gov |
| 5/13/19 | 7:10 AM | 5.2 | 85.8 km | 54,130 m | 24km NNE of Pampas, Peru | usgs.gov |
| 2/19/19 | 6:11 AM | 4.5 | 80.6 km | 110,130 m | 20km WNW of San Ramon, Peru | usgs.gov |
| 2/13/19 | 5:03 PM | 4.9 | 5.5 km | 10,000 m | 5km N of Jauja, Peru | usgs.gov |
| 11/13/18 | 11:40 AM | 4.4 | 77.9 km | 61,680 m | 21km N of Pampas, Peru | usgs.gov |
| 11/24/17 | 4:15 PM | 4.4 | 78.8 km | 90,960 m | 44km SE of Matucana, Peru | usgs.gov |
| 9/18/17 | 6:10 AM | 4.2 | 60 km | 107,440 m | 12km S of San Pedro de Cajas, Peru | usgs.gov |
| 9/1/17 | 6:16 PM | 4.5 | 72.8 km | 101,690 m | 2km WSW of San Ramon, Peru | usgs.gov |
| 7/11/17 | 10:28 PM | 4.4 | 88.3 km | 15,980 m | 17km NNW of San Ramon, Peru | usgs.gov |
| 4/19/17 | 7:21 AM | 4.7 | 67.2 km | 19,980 m | 16km ENE of San Pedro de Cajas, Peru | usgs.gov |
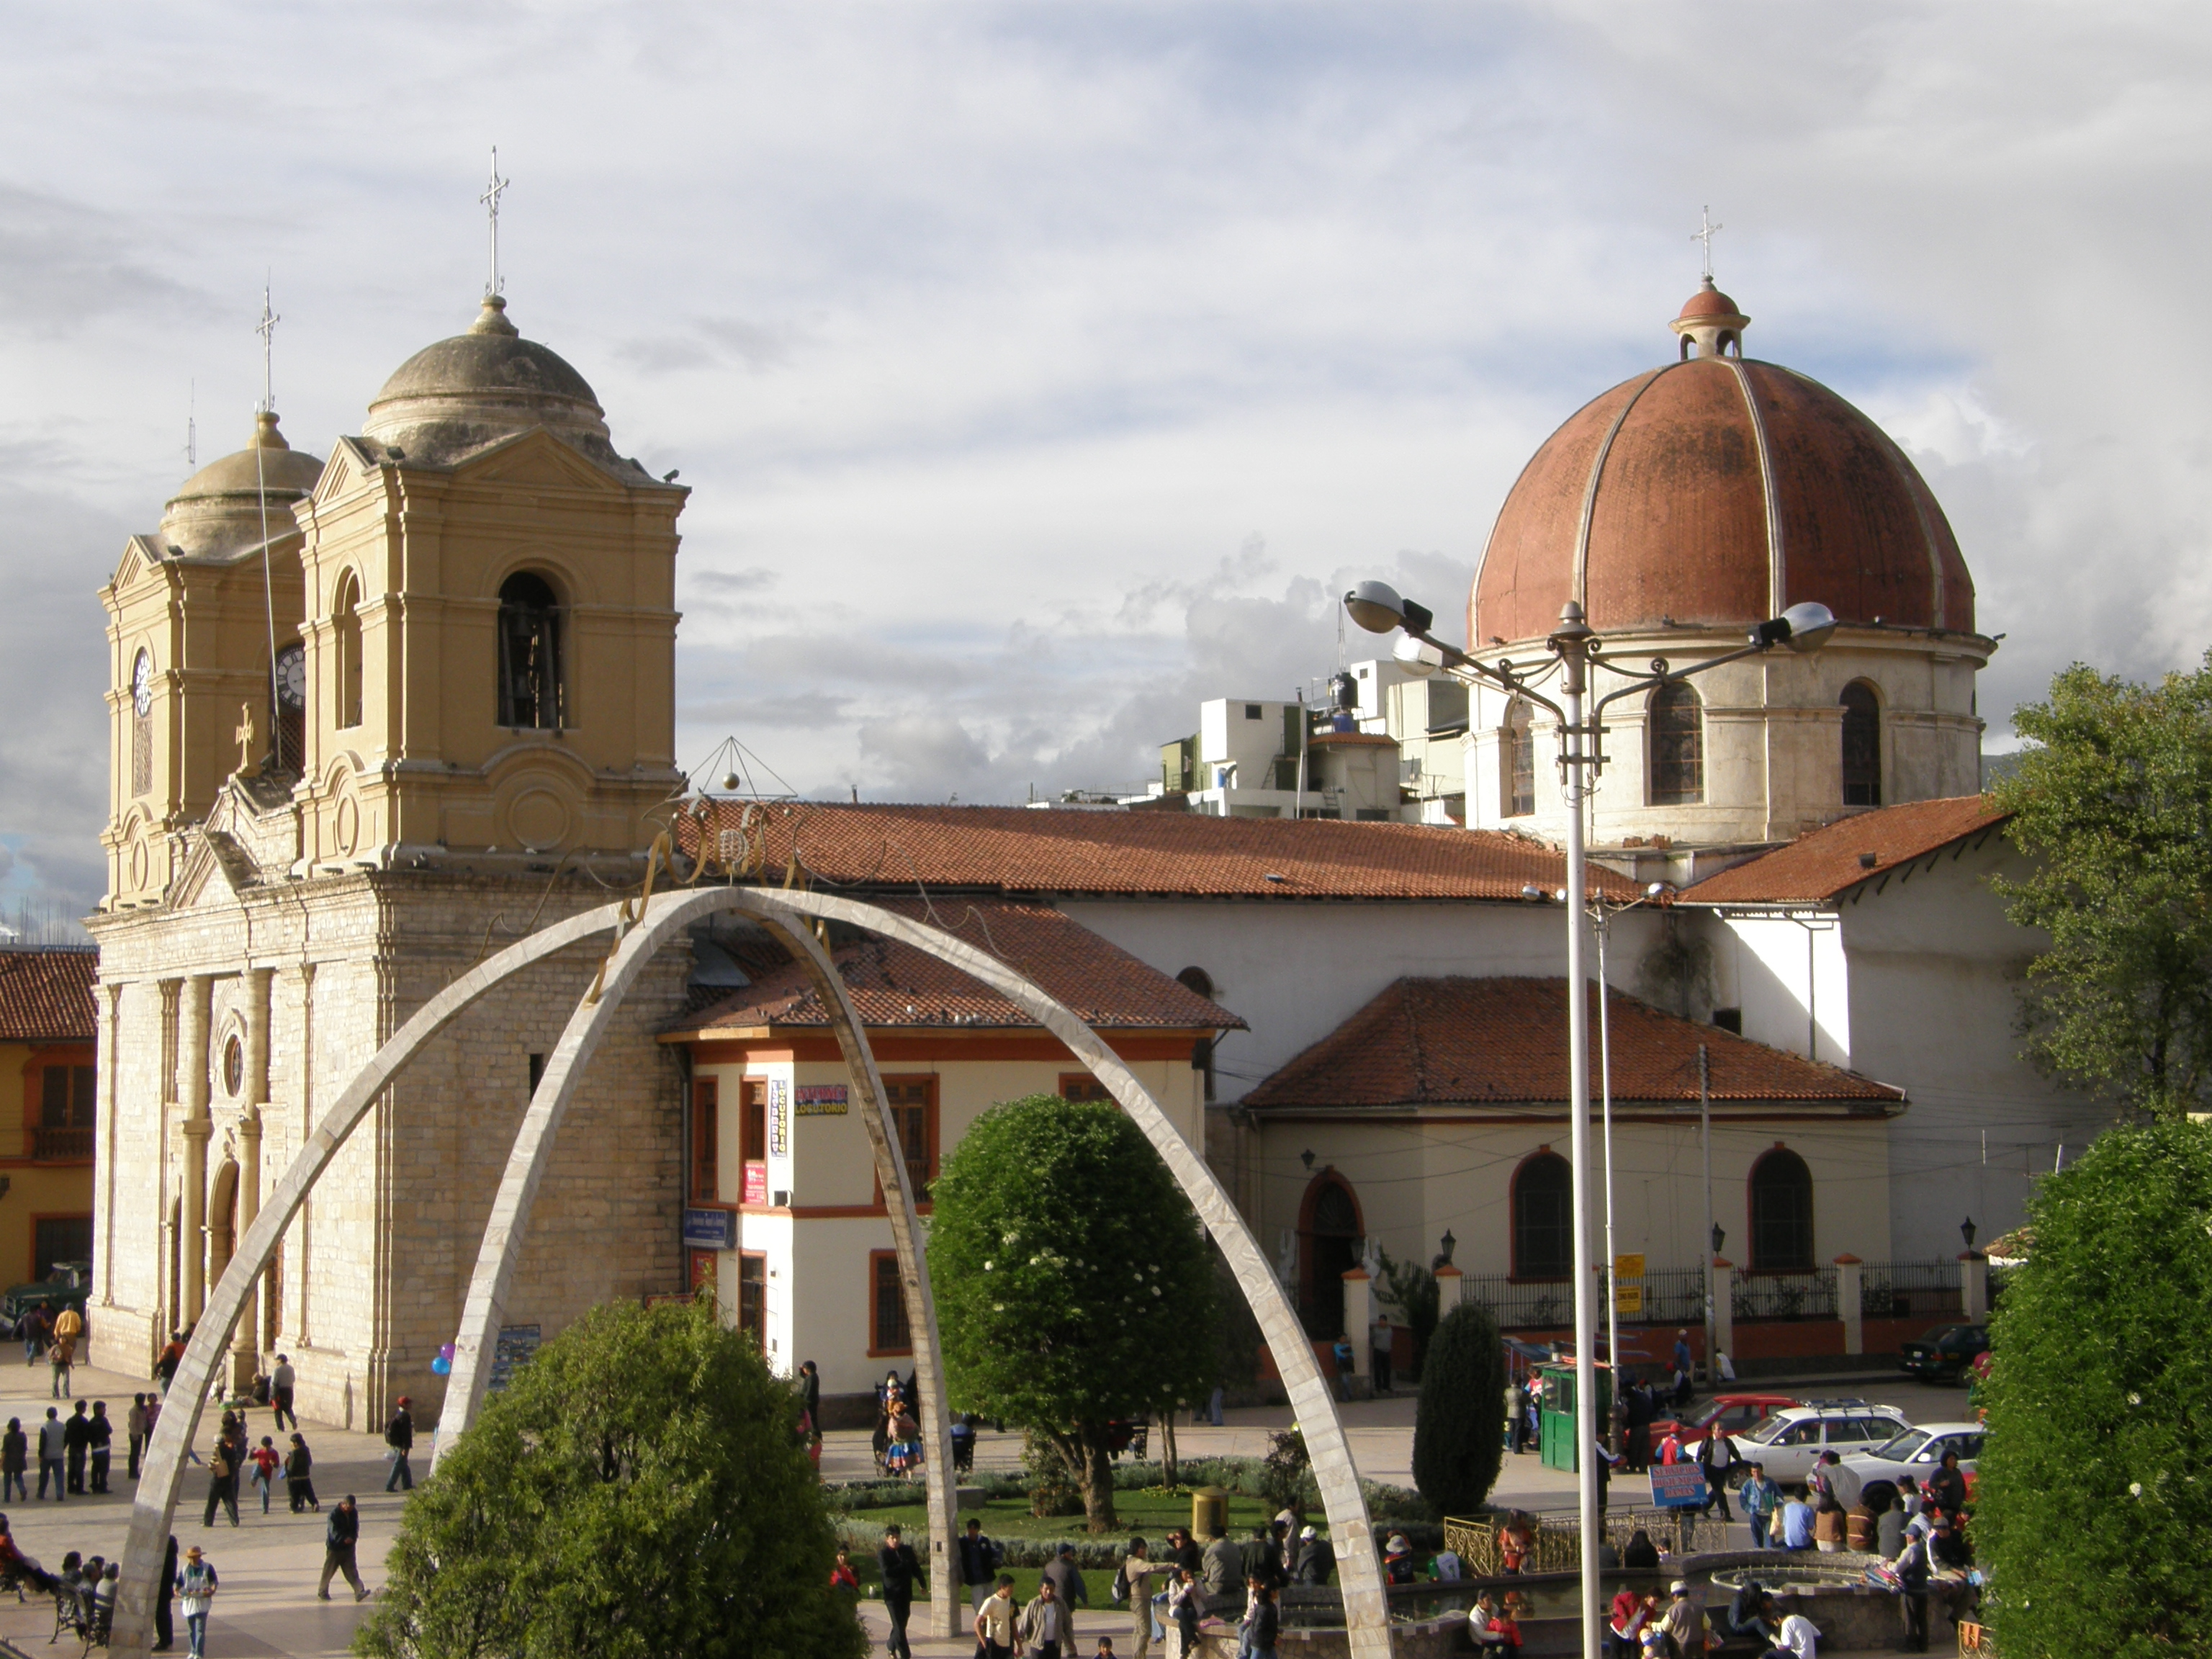
Jauja
Jauja (Shawsha Wanka Quechua: Shawsha or Shausha, formerly in Spanish Xauxa, with pronunciation of "x" as "sh") is a city and capital of Jauja Province in Peru. It is situated in the fertile Mantaro Valley, 45 kilometres (28 mi) to the northwest of H..
Jauja Wikipedia Page


About Our Data
The data on this page is estimated using a number of publicly available tools and resources. It is provided without warranty, and could contain inaccuracies. Use at your own risk.