Categories in Panabo
Industries
Business Distribution by Industry in Panabo
| Industry Description | Number of Establishments |
|---|---|
| Shopping | 215 |
| Restaurants | 210 |
| Education | 98 |
| Churches | 85 |
| Travel and transportation | 83 |
| Public administration | 82 |
| Grocery stores and supermarkets | 74 |
| Health and medical | 67 |
Panabo Facts
| Area | 287.3 km² |
| Population | 278,221 |
| Male Population | 140,907 (50.6%) |
| Female Population | 137,314 (49.4%) |
| Population change (1975 to 2020) | +1178.5% |
| Population change (2000 to 2020) | +104.2% |
| Median Age | 23.9 years (Male: 23.9, Female: 24) |
| Neighborhoods | Poblacion, Angliongto, Bunawan, Talomo, Tugbok |
| Local Time | |
| Timezone | Philippine Standard Time |
| Lat & Lng | 7.30806, 125.68417 |
| Zip Codes | 8105 |
Map of Panabo
Interactive Map
Panabo Population
Years 1975 to 2020
| Data | 1975 | 1990 | 2000 | 2015 | 2020 |
|---|---|---|---|---|---|
| Population | 21,761 | 76,771 | 136,216 | 255,120 | 278,221 |
| Population Density | 75.7 / km² | 267.2 / km² | 474.1 / km² | 888 / km² | 968.4 / km² |
Panabo Population change from 2000 to 2015
Increase of 87.3% from year 2000 to 2015
| Location | Change since 1975 | Change since 1990 | Change since 2000 |
|---|---|---|---|
| Panabo | +1072.4% | +232.3% | +87.3% |
| Philippines | +146.5% | +63.3% | +29.5% |
Panabo Median Age
Median Age: 23.9 years
| Location | Median Age | Median Age (Female) | Median Age (Male) |
|---|---|---|---|
| Panabo | 23.9 yrs | 24 yrs | 23.9 yrs |
| Philippines | 23.2 yrs | 23.6 yrs | 22.8 yrs |
Panabo Population Density
Population Density: 968 / km²
| Location | Population | Area | Density |
|---|---|---|---|
| Panabo | 278,221 | 287.3 km² | 968 / km² |
| Philippines | 96.6 million | 296,939.4 km² | 325 / km² |
Panabo Historical and Projected Population
Estimated Population from 1930 to 2100
- JRC (European Commission's Joint Research Centre) work on the GHS built-up grid
- CIESIN (Center for International Earth Science Information Network)
- [Link] Klein Goldewijk, K., Beusen, A., Doelman, J., and Stehfest, E.: Anthropogenic land use estimates for the Holocene – HYDE 3.2, Earth Syst. Sci. Data, 9, 927–953, https://doi.org/10.5194/essd-9-927-2017, 2017.
Neighborhoods in Panabo
Percentage of businesses by neighborhood in Panabo
Area Codes
Percentage Area Codes used by businesses in Panabo
Price Distribution
Business distribution by price for Panabo
Human Development Index (HDI)
Statistic composite index of life expectancy, education, and per capita income.
Panabo CO2 Emissions
Carbon Dioxide (CO2) Emissions Per Capita in Tonnes Per Year
| Location | CO2 Emissions | CO2 Emissions Per Capita | CO2 Emissions Intensity |
|---|---|---|---|
| Panabo | 321,856 tn | 1.16 tn | 1,120.2 tons/km² |
| Philippines | 104,920,564 tn | 1.09 tn | 353.3 tons/km² |
| 2013 CO2 emissions (tonnes/year) | 321,856 tn |
| 2013 CO2 emissions (tonnes/year) per capita | 1.16 tn |
| 2013 CO2 emissions intensity (tonnes/km²/year) | 1,120.2 tons/km² |
Natural Hazards Risk
Relative risk out of 10
| Hazard | Risk Level |
|---|---|
| Drought | Low (2) |
| Flood | High (10) |
| Earthquake | High (8) |
| Cyclone | High (8) |
| Landslide | High (8) |
* Risk, particularly concerning flood or landslide, may not be for the entire area.
- Dilley, M., R.S. Chen, U. Deichmann, A.L. Lerner-Lam, M. Arnold, J. Agwe, P. Buys, O. Kjekstad, B. Lyon, and G. Yetman. 2005. Natural Disaster Hotspots: A Global Risk Analysis. Washington, D.C.: World Bank. https://doi.org/10.1596/0-8213-5930-4.
- Center for Hazards and Risk Research - CHRR - Columbia University, Center for International Earth Science Information Network - CIESIN - Columbia University, and Norwegian Geotechnical Institute - NGI. 2005. Global Landslide Hazard Distribution. Palisades, NY: NASA Socioeconomic Data and Applications Center (SEDAC). https://doi.org/10.7927/H4P848VZ.
- Center for Hazards and Risk Research - CHRR - Columbia University, Center for International Earth Science Information Network - CIESIN - Columbia University, International Bank for Reconstruction and Development - The World Bank, and United Nations Environment Programme Global Resource Information Database Geneva - UNEP/GRID-Geneva. 2005. Global Cyclone Hazard Frequency and Distribution. Palisades, NY: NASA Socioeconomic Data and Applications Center (SEDAC). https://doi.org/10.7927/H4CZ353K.
- Center for Hazards and Risk Research - CHRR - Columbia University, Center for International Earth Science Information Network - CIESIN - Columbia University, and International Research Institute for Climate and Society - IRI - Columbia University. 2005. Global Drought Hazard Frequency and Distribution. Palisades, NY: NASA Socioeconomic Data and Applications Center (SEDAC). https://doi.org/10.7927/H4VX0DFT.
- Center for Hazards and Risk Research - CHRR - Columbia University, Center for International Earth Science Information Network - CIESIN - Columbia University. 2005. Global Flood Hazard Frequency and Distribution. Palisades, NY: NASA Socioeconomic Data and Applications Center (SEDAC). https://doi.org/10.7927/H4668B3D.
- Center for Hazards and Risk Research - CHRR - Columbia University, Center for International Earth Science Information Network - CIESIN - Columbia University. 2005. Global Earthquake Hazard Distribution - Peak Ground Acceleration. Palisades, NY: NASA Socioeconomic Data and Applications Center (SEDAC). https://doi.org/10.7927/H4BZ63ZS.
Recent Nearby Earthquakes
Magnitude 3.0 and greater
| Date▼ | Time↕ | Magnitude↕ | Distance↕ | Depth↕ | Location↕ | Link |
|---|---|---|---|---|---|---|
| 10/3/18 | 9:44 PM | 4.5 | 30.4 km | 35,000 m | 6km ESE of Aumbay, Philippines | usgs.gov |
| 8/30/17 | 5:31 PM | 4.5 | 38.6 km | 29,380 m | 12km SW of Tombongon, Philippines | usgs.gov |
| 4/1/17 | 1:33 PM | 4.3 | 56.2 km | 124,690 m | 12km S of San Remigio, Philippines | usgs.gov |
| 2/23/17 | 11:17 AM | 4.2 | 13.4 km | 15,500 m | 6km WSW of Maduao, Philippines | usgs.gov |
| 2/23/17 | 1:50 AM | 4.7 | 28.9 km | 11,860 m | 3km WSW of Davao, Philippines | usgs.gov |
| 2/16/17 | 6:27 AM | 4.5 | 50.1 km | 24,770 m | 2km SSW of Baracatan, Philippines | usgs.gov |
| 2/11/17 | 9:15 AM | 4.6 | 52.9 km | 16,190 m | 3km W of Astorga, Philippines | usgs.gov |
| 12/5/16 | 3:38 PM | 4.5 | 69.2 km | 61,110 m | 2km E of Davan, Philippines | usgs.gov |
| 11/29/16 | 10:37 AM | 4.2 | 30.3 km | 10,000 m | 0km NW of Luna, Philippines | usgs.gov |
| 11/23/16 | 11:24 PM | 4.5 | 45.5 km | 19,360 m | 12km ENE of Tombongon, Philippines | usgs.gov |
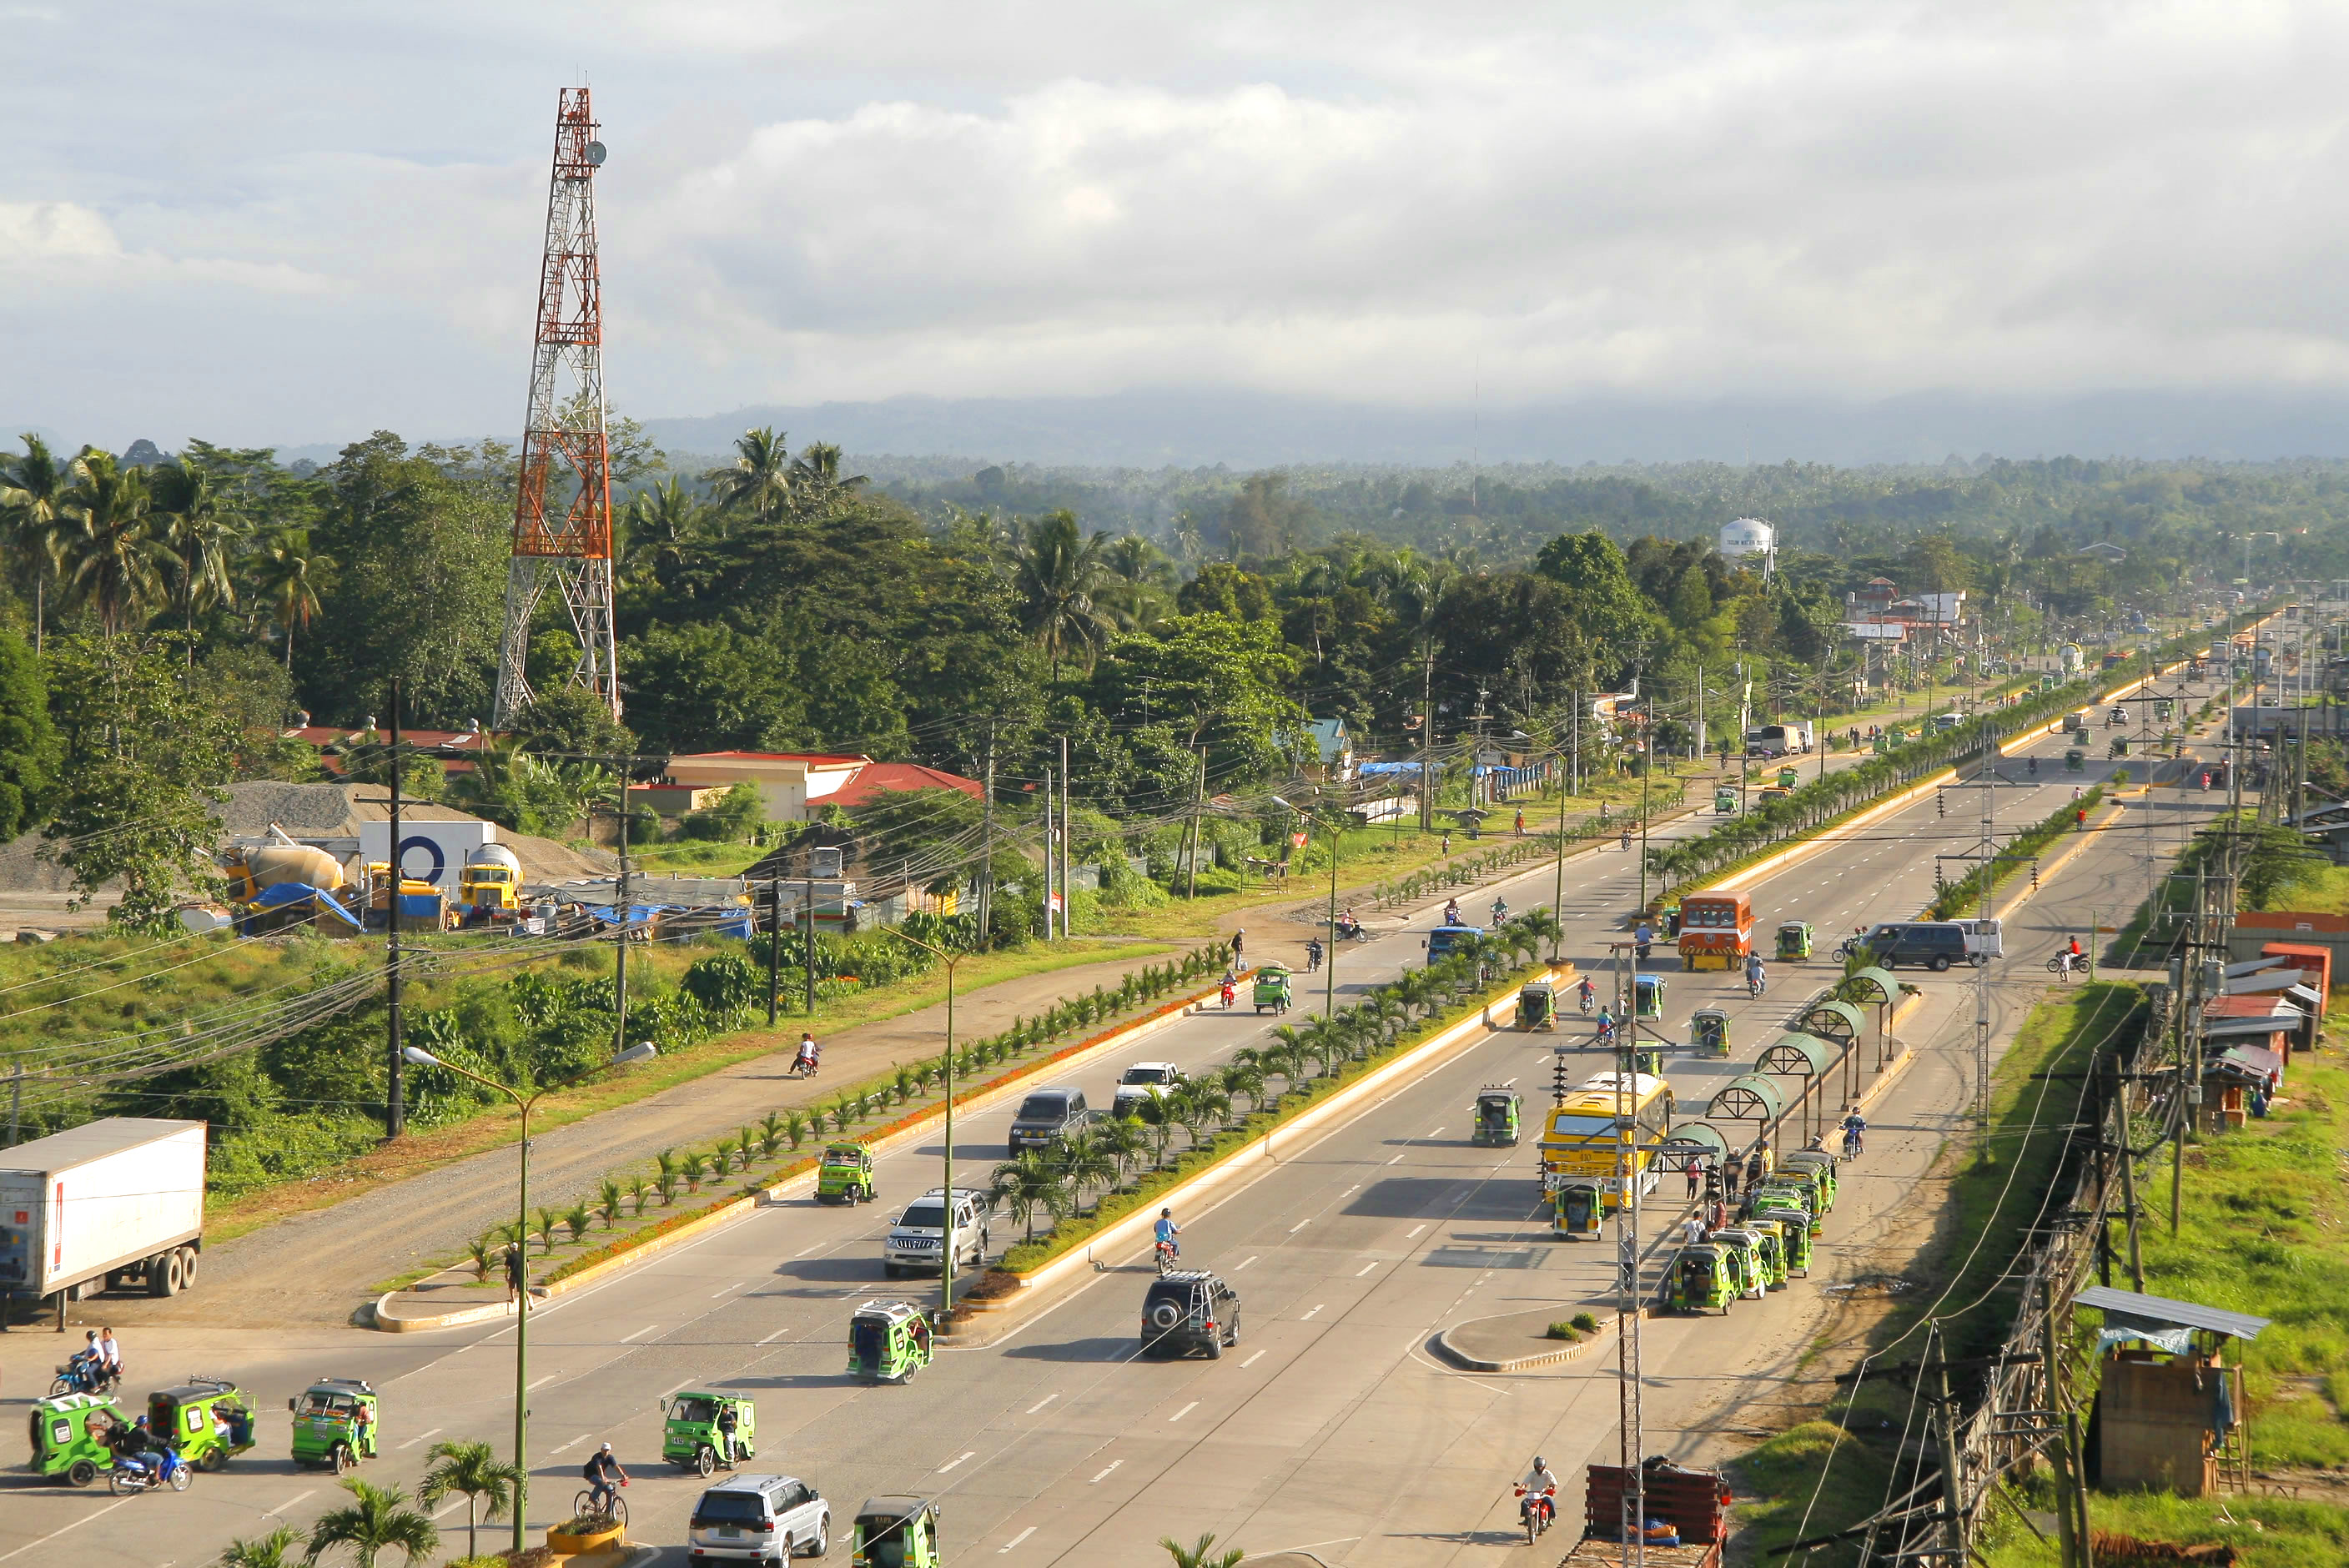
Panabo
Panabo is a third-class component city (Filipino: Lungsod ng Panabo, Cebuano: Dakbayan sa Panabo) in the province of Davao del Norte, Philippines, bordering Davao City to its northeast. The city has an area of 25,123 hectares (62,080 acres). Accordin..
Panabo Wikipedia Page
About Our Data
The data on this page is estimated using a number of publicly available tools and resources. It is provided without warranty, and could contain inaccuracies. Use at your own risk.