Categories in Vigan
Industries
Business Distribution by Industry in Vigan
| Industry Description | Number of Establishments |
|---|---|
| Restaurants | 276 |
| Hotels and motels | 119 |
| Other accommodation | 117 |
| Shopping | 113 |
| Health and medical | 93 |
| Corporate management | 92 |
| Grocery stores and supermarkets | 70 |
| Public administration | 60 |
| Education | 52 |
| Cafes | 50 |
| Clothing stores | 49 |
| Business services | 45 |
| Beauty salons | 43 |
| Banks | 42 |
| Higher education (colleges and universities) | 40 |
Vigan Facts
| Area | 15.8 km² |
| Population | 49,301 |
| Male Population | 24,393 (49.5%) |
| Female Population | 24,908 (50.5%) |
| Population change (1975 to 2020) | +453.4% |
| Population change (2000 to 2020) | +46.6% |
| Median Age | 26.5 years (Male: 25.5, Female: 27.5) |
| Neighborhoods | San Julioan Norte, San Julian Norte, Brgy. I, Caniogan, Salindeg |
| Local Time | |
| Timezone | Philippine Standard Time |
| Lat & Lng | 17.57472, 120.38694 |
| Zip Codes | 2700 |
Map of Vigan
Interactive Map
Vigan Population
Years 1975 to 2020
| Data | 1975 | 1990 | 2000 | 2015 | 2020 |
|---|---|---|---|---|---|
| Population | 8,908 | 23,424 | 33,638 | 45,511 | 49,301 |
| Population Density | 565.6 / km² | 1,487.2 / km² | 2,135.7 / km² | 2,889.6 / km² | 3,130.2 / km² |
Vigan Population change from 2000 to 2015
Increase of 35.3% from year 2000 to 2015
| Location | Change since 1975 | Change since 1990 | Change since 2000 |
|---|---|---|---|
| Vigan | +410.9% | +94.3% | +35.3% |
| Philippines | +146.5% | +63.3% | +29.5% |
Vigan Median Age
Median Age: 26.5 years
| Location | Median Age | Median Age (Female) | Median Age (Male) |
|---|---|---|---|
| Vigan | 26.5 yrs | 27.5 yrs | 25.5 yrs |
| Philippines | 23.2 yrs | 23.6 yrs | 22.8 yrs |
Vigan Population Density
Population Density: 3,130 / km²
| Location | Population | Area | Density |
|---|---|---|---|
| Vigan | 49,301 | 15.8 km² | 3,130 / km² |
| Philippines | 96.6 million | 296,939.4 km² | 325 / km² |
Vigan Historical and Projected Population
Estimated Population from 1860 to 2100
- JRC (European Commission's Joint Research Centre) work on the GHS built-up grid
- CIESIN (Center for International Earth Science Information Network)
- [Link] Klein Goldewijk, K., Beusen, A., Doelman, J., and Stehfest, E.: Anthropogenic land use estimates for the Holocene – HYDE 3.2, Earth Syst. Sci. Data, 9, 927–953, https://doi.org/10.5194/essd-9-927-2017, 2017.
Neighborhoods in Vigan
Percentage of businesses by neighborhood in Vigan
Area Codes
Percentage Area Codes used by businesses in Vigan
Price Distribution
Business distribution by price for Vigan
Human Development Index (HDI)
Statistic composite index of life expectancy, education, and per capita income.
Vigan CO2 Emissions
Carbon Dioxide (CO2) Emissions Per Capita in Tonnes Per Year
| Location | CO2 Emissions | CO2 Emissions Per Capita | CO2 Emissions Intensity |
|---|---|---|---|
| Vigan | 57,748 tn | 1.17 tn | 3,666.5 tons/km² |
| Philippines | 104,920,564 tn | 1.09 tn | 353.3 tons/km² |
| 2013 CO2 emissions (tonnes/year) | 57,748 tn |
| 2013 CO2 emissions (tonnes/year) per capita | 1.17 tn |
| 2013 CO2 emissions intensity (tonnes/km²/year) | 3,666.5 tons/km² |
Natural Hazards Risk
Relative risk out of 10
| Hazard | Risk Level |
|---|---|
| Earthquake | High (8) |
| Cyclone | High (10) |
* Risk, particularly concerning flood or landslide, may not be for the entire area.
- Dilley, M., R.S. Chen, U. Deichmann, A.L. Lerner-Lam, M. Arnold, J. Agwe, P. Buys, O. Kjekstad, B. Lyon, and G. Yetman. 2005. Natural Disaster Hotspots: A Global Risk Analysis. Washington, D.C.: World Bank. https://doi.org/10.1596/0-8213-5930-4.
- Center for Hazards and Risk Research - CHRR - Columbia University, Center for International Earth Science Information Network - CIESIN - Columbia University, International Bank for Reconstruction and Development - The World Bank, and United Nations Environment Programme Global Resource Information Database Geneva - UNEP/GRID-Geneva. 2005. Global Cyclone Hazard Frequency and Distribution. Palisades, NY: NASA Socioeconomic Data and Applications Center (SEDAC). https://doi.org/10.7927/H4CZ353K.
- Center for Hazards and Risk Research - CHRR - Columbia University, Center for International Earth Science Information Network - CIESIN - Columbia University. 2005. Global Earthquake Hazard Distribution - Peak Ground Acceleration. Palisades, NY: NASA Socioeconomic Data and Applications Center (SEDAC). https://doi.org/10.7927/H4BZ63ZS.
Recent Nearby Earthquakes
Magnitude 3.0 and greater
| Date▼ | Time↕ | Magnitude↕ | Distance↕ | Depth↕ | Location↕ | Link |
|---|---|---|---|---|---|---|
| 2/24/19 | 7:27 PM | 4.5 | 27 km | 37,320 m | 15km NNW of Puro Pingit, Philippines | usgs.gov |
| 11/25/18 | 9:21 AM | 4.7 | 47.5 km | 30,120 m | 4km SE of Nueva Era, Philippines | usgs.gov |
| 10/30/18 | 1:32 AM | 4.6 | 55.5 km | 35,000 m | 1km WSW of Callaguip, Philippines | usgs.gov |
| 9/28/18 | 12:03 AM | 4.3 | 49.9 km | 10,000 m | 13km SE of Nueva Era, Philippines | usgs.gov |
| 5/30/18 | 10:46 AM | 4.6 | 53.9 km | 52,710 m | 4km NW of Espiritu, Philippines | usgs.gov |
| 2/22/18 | 8:19 AM | 4 | 52.3 km | 57,490 m | 47km WNW of Darapidap, Philippines | usgs.gov |
| 2/13/18 | 3:27 PM | 4.4 | 24.2 km | 61,090 m | 12km WNW of Tamorong, Philippines | usgs.gov |
| 10/19/17 | 7:06 AM | 4.8 | 21.2 km | 10,000 m | 17km WSW of Fuerte, Philippines | usgs.gov |
| 6/25/17 | 9:18 AM | 4.1 | 17.5 km | 61,010 m | 12km SSW of Fuerte, Philippines | usgs.gov |
| 6/24/17 | 8:37 PM | 4.9 | 27.1 km | 41,350 m | 22km SW of Fuerte, Philippines | usgs.gov |
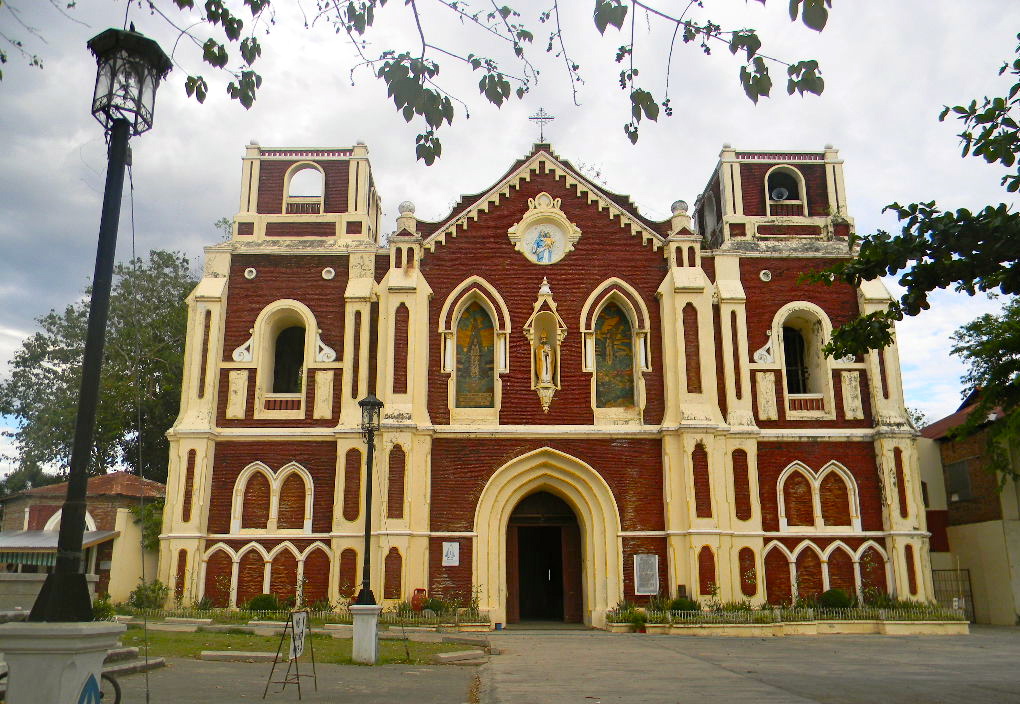
Vigan
Vigan, officially the City of Vigan (Ilocano: Ciudad ti Bigan; Tagalog: Lungsod ng Vigan) is a fourth class city and capital of the province of Ilocos Sur in the Philippines. The city is located on the western coast of the large island of Luzon, faci..
Vigan Wikipedia Page

About Our Data
The data on this page is estimated using a number of publicly available tools and resources. It is provided without warranty, and could contain inaccuracies. Use at your own risk.