Categories in Bhaun
Industries
Business Distribution by Industry in Bhaun
| Industry Description | Number of Establishments |
|---|---|
| Mosques | 16 |
| Shopping other | 9 |
| Shopping | 9 |
Bhaun Facts
| Area | 2.1 km² |
| Population | 13,756 |
| Male Population | 6,496 (47.2%) |
| Female Population | 7,260 (52.8%) |
| Population change (1975 to 2020) | -61.1% |
| Population change (2000 to 2020) | +30.8% |
| Median Age | 23.1 years (Male: 21.2, Female: 24.7) |
| Local Time | |
| Timezone | Pakistan Standard Time |
| Lat & Lng | 32.85654, 72.75712 |
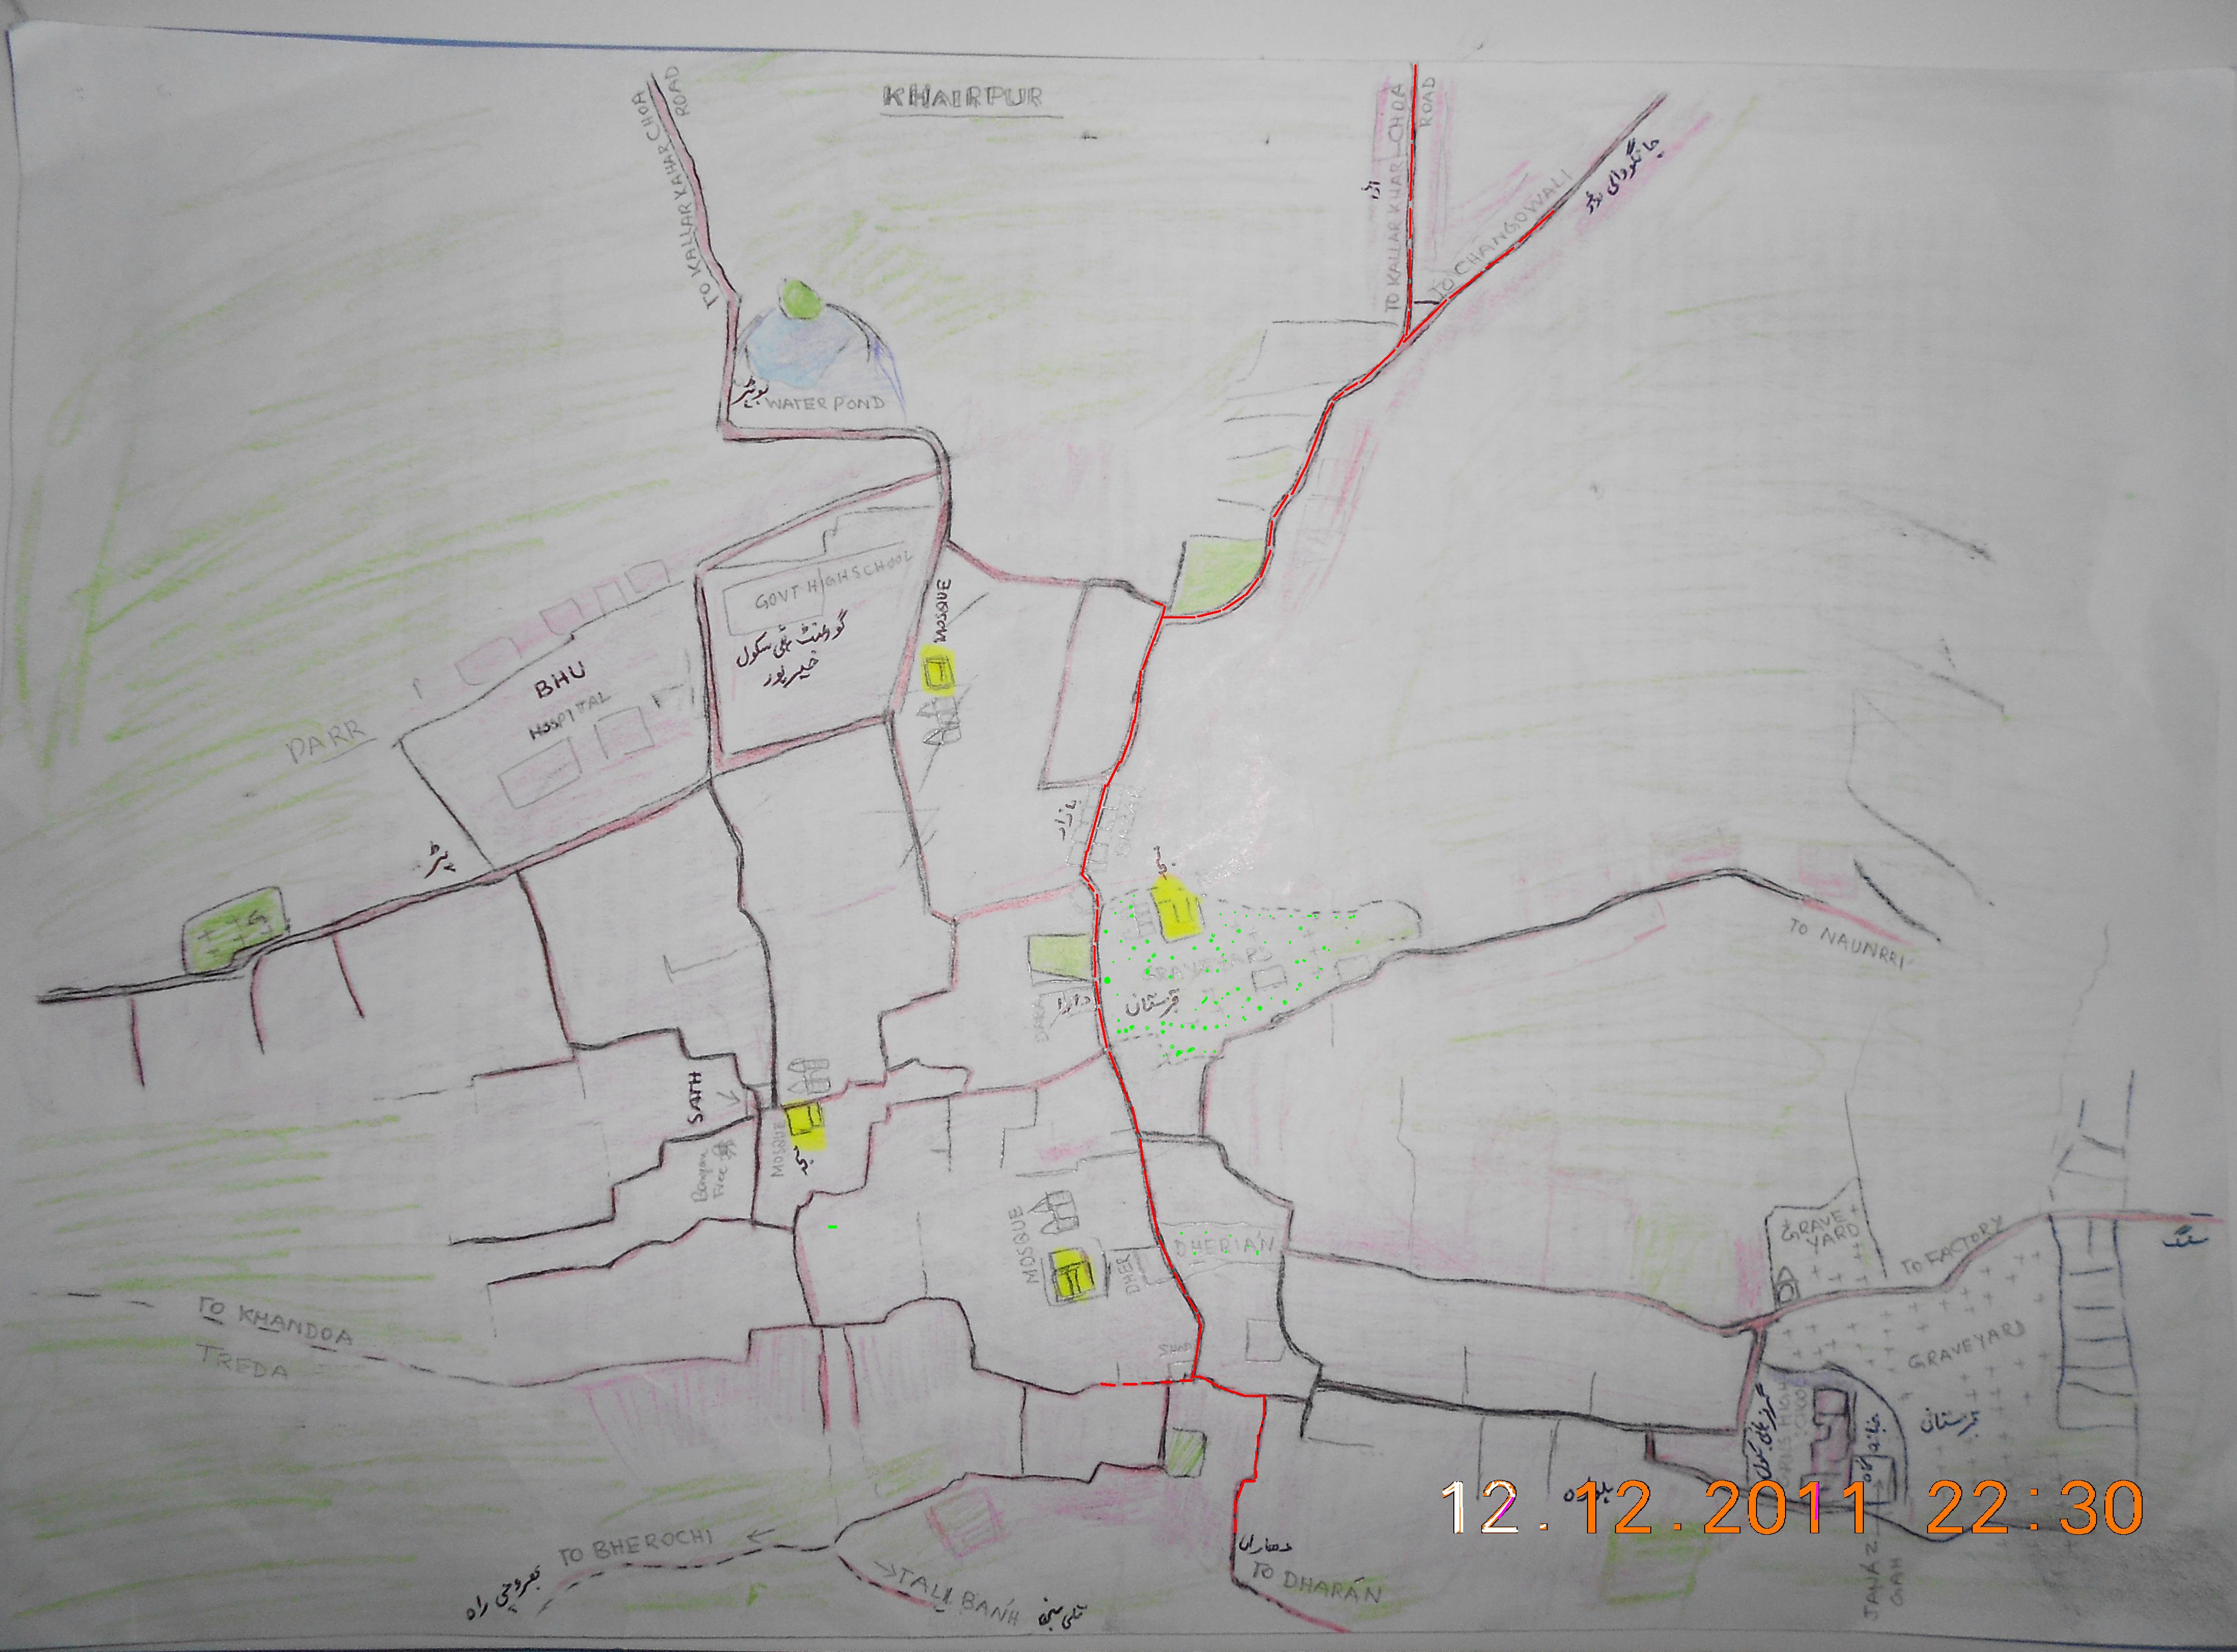
Map of Bhaun
Interactive Map
Bhaun Population
Years 1975 to 2020
| Data | 1975 | 1990 | 2000 | 2015 | 2020 |
|---|---|---|---|---|---|
| Population | 35,368 | 16,471 | 10,520 | 12,523 | 13,756 |
| Population Density | 17,148.1 / km² | 7,985.9 / km² | 5,100.6 / km² | 6,071.8 / km² | 6,669.6 / km² |
Bhaun Population change from 2000 to 2015
Increase of 19% from year 2000 to 2015
| Location | Change since 1975 | Change since 1990 | Change since 2000 |
|---|---|---|---|
| Bhaun | -64.6% | -24% | +19% |
| West Punjab | +195.8% | +79.7% | +38.2% |
| Pakistan | +183.1% | +75.7% | +36.7% |
Bhaun Median Age
Median Age: 23.1 years
| Location | Median Age | Median Age (Female) | Median Age (Male) |
|---|---|---|---|
| Bhaun | 23.1 yrs | 24.7 yrs | 21.2 yrs |
| West Punjab | 21.1 yrs | 21 yrs | 21.1 yrs |
| Pakistan | 21.1 yrs | 21 yrs | 21.1 yrs |
Bhaun Population Density
Population Density: 6,670 / km²
| Location | Population | Area | Density |
|---|---|---|---|
| Bhaun | 13,756 | 2.063 km² | 6,670 / km² |
| West Punjab | 102.8 million | 203,843.5 km² | 504 / km² |
| Pakistan | 188.8 million | 876,288.9 km² | 215 / km² |
Bhaun Historical and Projected Population
Estimated Population from 0 to 2100
- JRC (European Commission's Joint Research Centre) work on the GHS built-up grid
- CIESIN (Center for International Earth Science Information Network)
- [Link] Klein Goldewijk, K., Beusen, A., Doelman, J., and Stehfest, E.: Anthropogenic land use estimates for the Holocene – HYDE 3.2, Earth Syst. Sci. Data, 9, 927–953, https://doi.org/10.5194/essd-9-927-2017, 2017.
Human Development Index (HDI)
Statistic composite index of life expectancy, education, and per capita income.
Bhaun CO2 Emissions
Carbon Dioxide (CO2) Emissions Per Capita in Tonnes Per Year
| Location | CO2 Emissions | CO2 Emissions Per Capita | CO2 Emissions Intensity |
|---|---|---|---|
| Bhaun | 12,327 tn | 0.9 tn | 5,976.7 tons/km² |
| West Punjab | 91,777,401 tn | 0.89 tn | 450.2 tons/km² |
| Pakistan | 148,464,575 tn | 0.79 tn | 169.4 tons/km² |
| 2013 CO2 emissions (tonnes/year) | 12,327 tn |
| 2013 CO2 emissions (tonnes/year) per capita | 0.9 tn |
| 2013 CO2 emissions intensity (tonnes/km²/year) | 5,976.7 tons/km² |
Natural Hazards Risk
Relative risk out of 10
| Hazard | Risk Level |
|---|---|
| Flood | Medium (7) |
| Earthquake | Medium (7) |
* Risk, particularly concerning flood or landslide, may not be for the entire area.
- Dilley, M., R.S. Chen, U. Deichmann, A.L. Lerner-Lam, M. Arnold, J. Agwe, P. Buys, O. Kjekstad, B. Lyon, and G. Yetman. 2005. Natural Disaster Hotspots: A Global Risk Analysis. Washington, D.C.: World Bank. https://doi.org/10.1596/0-8213-5930-4.
- Center for Hazards and Risk Research - CHRR - Columbia University, Center for International Earth Science Information Network - CIESIN - Columbia University. 2005. Global Flood Hazard Frequency and Distribution. Palisades, NY: NASA Socioeconomic Data and Applications Center (SEDAC). https://doi.org/10.7927/H4668B3D.
- Center for Hazards and Risk Research - CHRR - Columbia University, Center for International Earth Science Information Network - CIESIN - Columbia University. 2005. Global Earthquake Hazard Distribution - Peak Ground Acceleration. Palisades, NY: NASA Socioeconomic Data and Applications Center (SEDAC). https://doi.org/10.7927/H4BZ63ZS.
Recent Nearby Earthquakes
Magnitude 3.0 and greater
| Date▼ | Time↕ | Magnitude↕ | Distance↕ | Depth↕ | Location↕ | Link |
|---|---|---|---|---|---|---|
| 4/10/18 | 11:47 AM | 3.6 | 94.7 km | 32,940 m | 14km SSE of Kahuta, Pakistan | usgs.gov |
| 8/27/17 | 12:24 PM | 4.6 | 82.6 km | 32,110 m | 7km WSW of Rawalpindi, Pakistan | usgs.gov |
| 3/21/17 | 5:56 AM | 4.3 | 77.2 km | 40,980 m | 32km SE of Sanjwal, Pakistan | usgs.gov |
| 11/24/16 | 2:16 PM | 4.5 | 41.1 km | 37,810 m | 33km NNW of Chakwal, Pakistan | usgs.gov |
| 7/24/15 | 9:30 PM | 4.6 | 70.8 km | 39,110 m | 5km N of Gujar Khan, Pakistan | usgs.gov |
| 4/19/14 | 8:12 PM | 4 | 61.3 km | 45,530 m | 25km NNW of Mandi Bahauddin, Pakistan | usgs.gov |
| 3/26/14 | 7:52 PM | 4 | 82.1 km | 5,320 m | 2km SSW of Nazir Town, Pakistan | usgs.gov |
| 12/4/13 | 10:58 AM | 4.2 | 95.7 km | 29,390 m | 4km SW of New Mirpur, Pakistan | usgs.gov |
| 4/4/13 | 5:39 PM | 4.5 | 35.6 km | 13,700 m | Pakistan | usgs.gov |
| 11/25/12 | 4:04 PM | 4.3 | 98 km | 32,000 m | Pakistan | usgs.gov |
Bhaun
Bhaun is a town in Chakwal District in the Punjab province of Pakistan 12 kilometres away from the district capital Chakwal. In 2007 Pakistan Railways announced the resumption of the Bhaun to Chakwal service. However, no progress has been made to thi..
Bhaun Wikipedia Page


About Our Data
The data on this page is estimated using a number of publicly available tools and resources. It is provided without warranty, and could contain inaccuracies. Use at your own risk.