Industries
Business Distribution by Industry in Cedynia
Cedynia Facts
| Area | 0.5 km² |
| Population | 346 |
| Male Population | 179 (51.6%) |
| Female Population | 167 (48.4%) |
| Population change (1975 to 2020) | -43.6% |
| Population change (2000 to 2020) | -26.1% |
| Median Age | 34.3 years (Male: 34.4, Female: 34.1) |
| Area Codes | 91 |
| Neighborhoods | Lubiechów Górny |
| Local Time | |
| Timezone | Central European Summer Time |
| Lat & Lng | 52.87931, 14.20249 |
| Postal Codes | 74-520 |
Map of Cedynia
Interactive Map
Cedynia Population
Years 1975 to 2020
| Data | 1975 | 1990 | 2000 | 2015 | 2020 |
|---|---|---|---|---|---|
| Population | 614 | 595 | 468 | 360 | 346 |
| Population Density | 1,228 / km² | 1,190 / km² | 936 / km² | 720 / km² | 692 / km² |
Cedynia Population change from 2000 to 2015
Decrease of 23.1% from year 2000 to 2015
| Location | Change since 1975 | Change since 1990 | Change since 2000 |
|---|---|---|---|
| Cedynia | -41.4% | -39.5% | -23.1% |
| West Pomeranian Voivodeship | +16.4% | +2.5% | +0.9% |
| Poland | +13% | +1.1% | +0.3% |
Cedynia Median Age
Median Age: 34.3 years
| Location | Median Age | Median Age (Female) | Median Age (Male) |
|---|---|---|---|
| Cedynia | 34.3 yrs | 34.1 yrs | 34.4 yrs |
| West Pomeranian Voivodeship | 35.6 yrs | 36.2 yrs | 35 yrs |
| Poland | 34.9 yrs | 35.6 yrs | 34.3 yrs |
Cedynia Population Density
Population Density: 692 / km²
| Location | Population | Area | Density |
|---|---|---|---|
| Cedynia | 346 | 0.5 km² | 692 / km² |
| West Pomeranian Voivodeship | 1.7 million | 22,897.6 km² | 75 / km² |
| Poland | 38.5 million | 312,592.3 km² | 123 / km² |
Cedynia Historical and Projected Population
Estimated Population from 0 to 2100
- JRC (European Commission's Joint Research Centre) work on the GHS built-up grid
- CIESIN (Center for International Earth Science Information Network)
- [Link] Klein Goldewijk, K., Beusen, A., Doelman, J., and Stehfest, E.: Anthropogenic land use estimates for the Holocene – HYDE 3.2, Earth Syst. Sci. Data, 9, 927–953, https://doi.org/10.5194/essd-9-927-2017, 2017.
Area Codes
Percentage Area Codes used by businesses in Cedynia
Price Distribution
Business distribution by price for Cedynia
Human Development Index (HDI)
Statistic composite index of life expectancy, education, and per capita income.
Cedynia CO2 Emissions
Carbon Dioxide (CO2) Emissions Per Capita in Tonnes Per Year
| Location | CO2 Emissions | CO2 Emissions Per Capita | CO2 Emissions Intensity |
|---|---|---|---|
| Cedynia | 2,128 tn | 6.15 tn | 4,255.2 tons/km² |
| West Pomeranian Voivodeship | 9,992,533 tn | 5.82 tn | 436.4 tons/km² |
| Poland | 230,825,573 tn | 5.99 tn | 738.4 tons/km² |
| 2013 CO2 emissions (tonnes/year) | 2,128 tn |
| 2013 CO2 emissions (tonnes/year) per capita | 6.15 tn |
| 2013 CO2 emissions intensity (tonnes/km²/year) | 4,255.2 tons/km² |
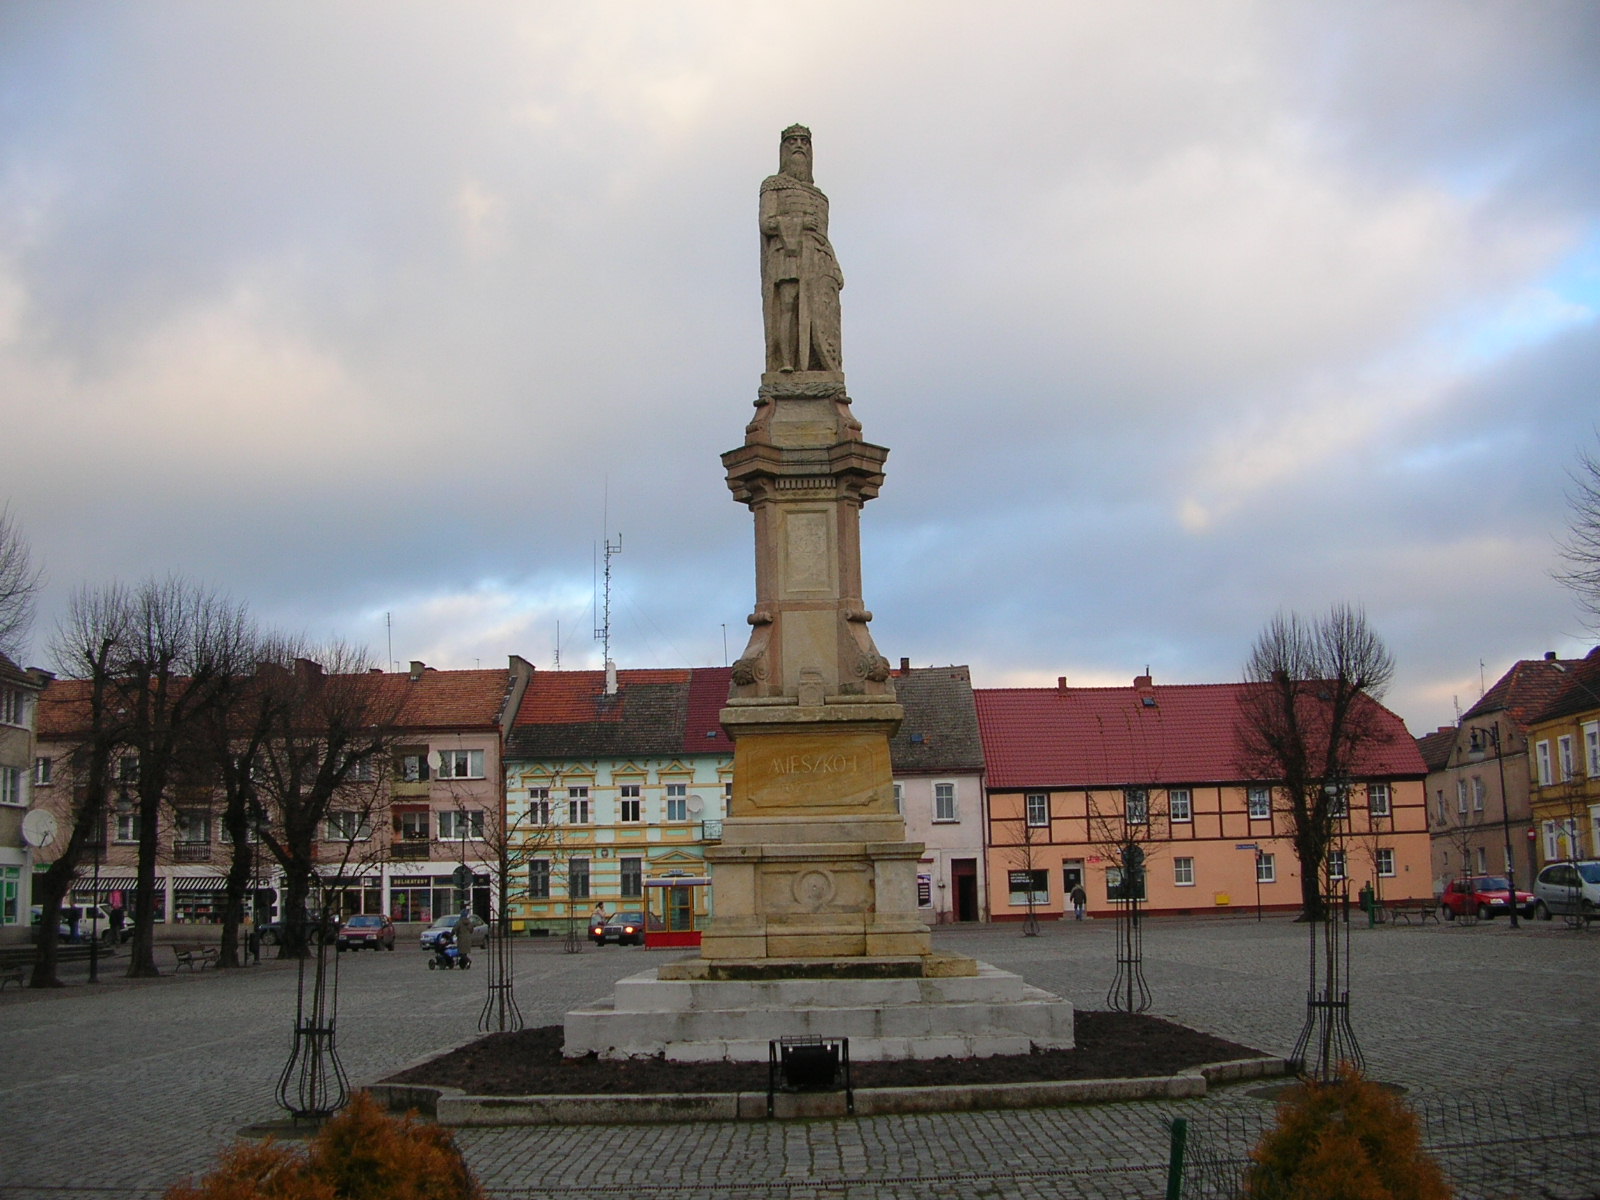
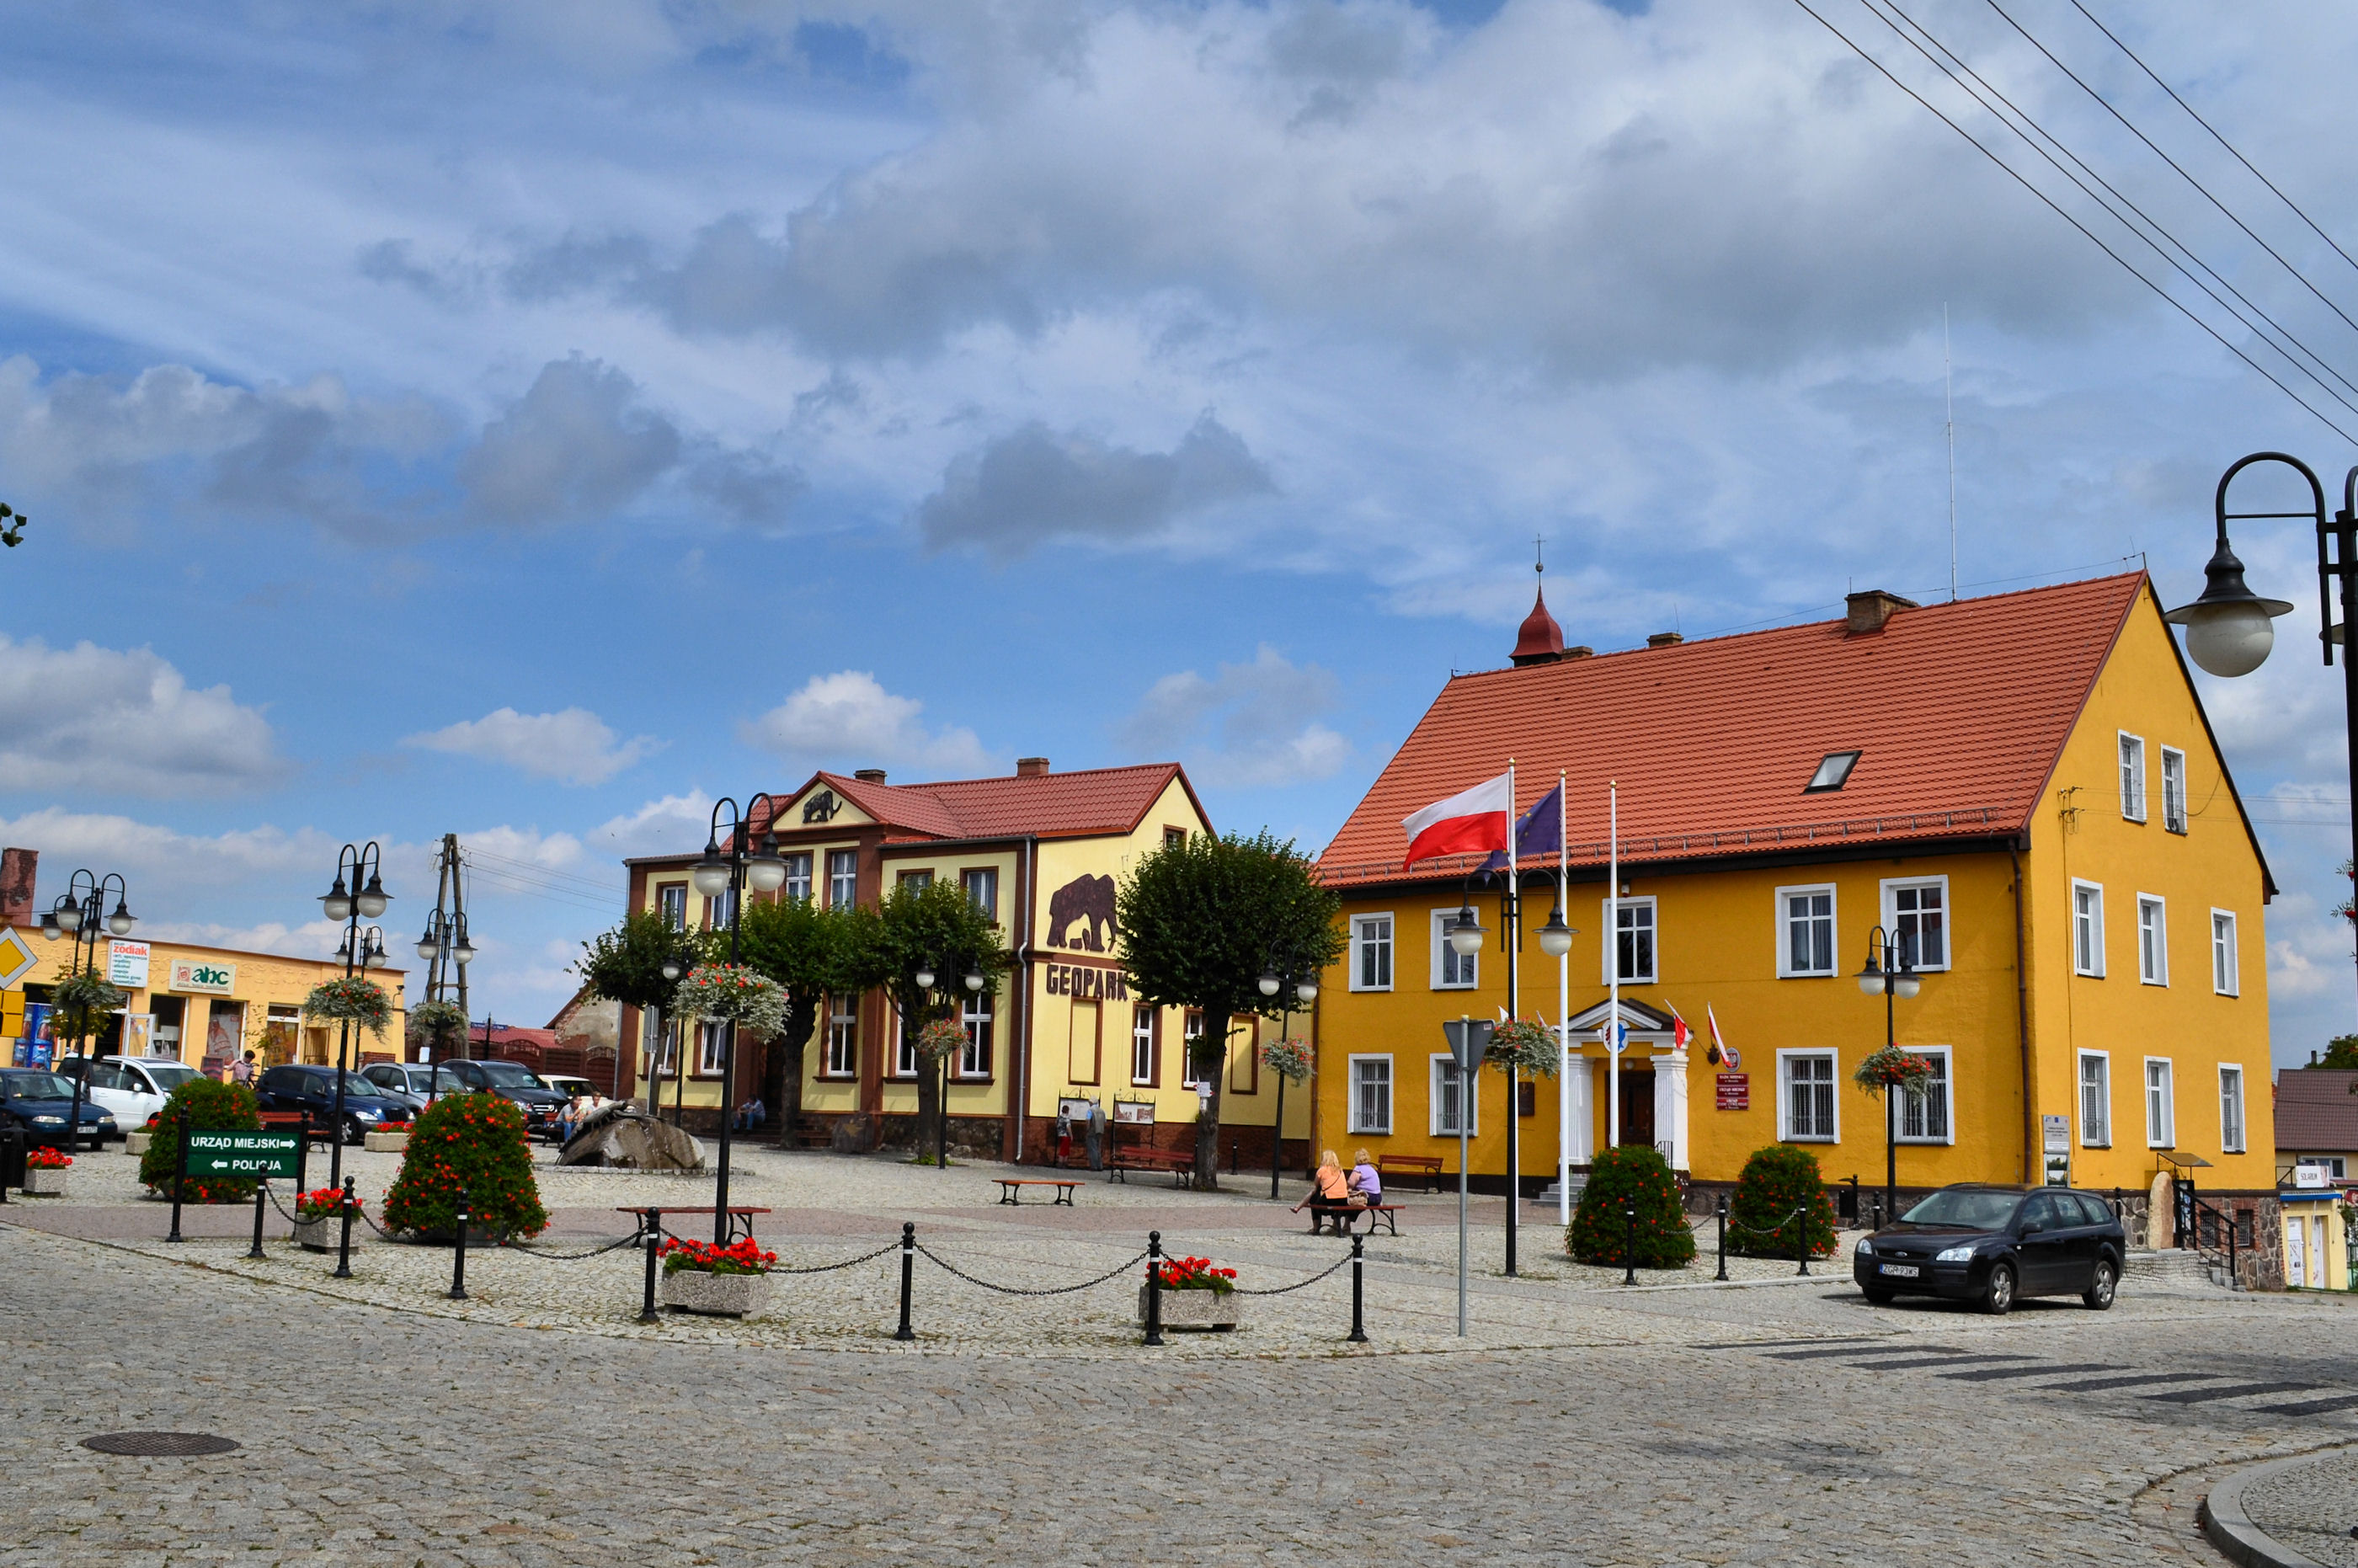
Cedynia
Cedynia [t͡sɛˈdɨɲa] (German: Zehden) is a town in Poland, in West Pomeranian Voivodeship, in Gryfino County. It lies close to the Oder River, near the border with Germany, and is the westernmost town in Poland. (Osinów Dolny lies 6 km even further to..
Cedynia Wikipedia Page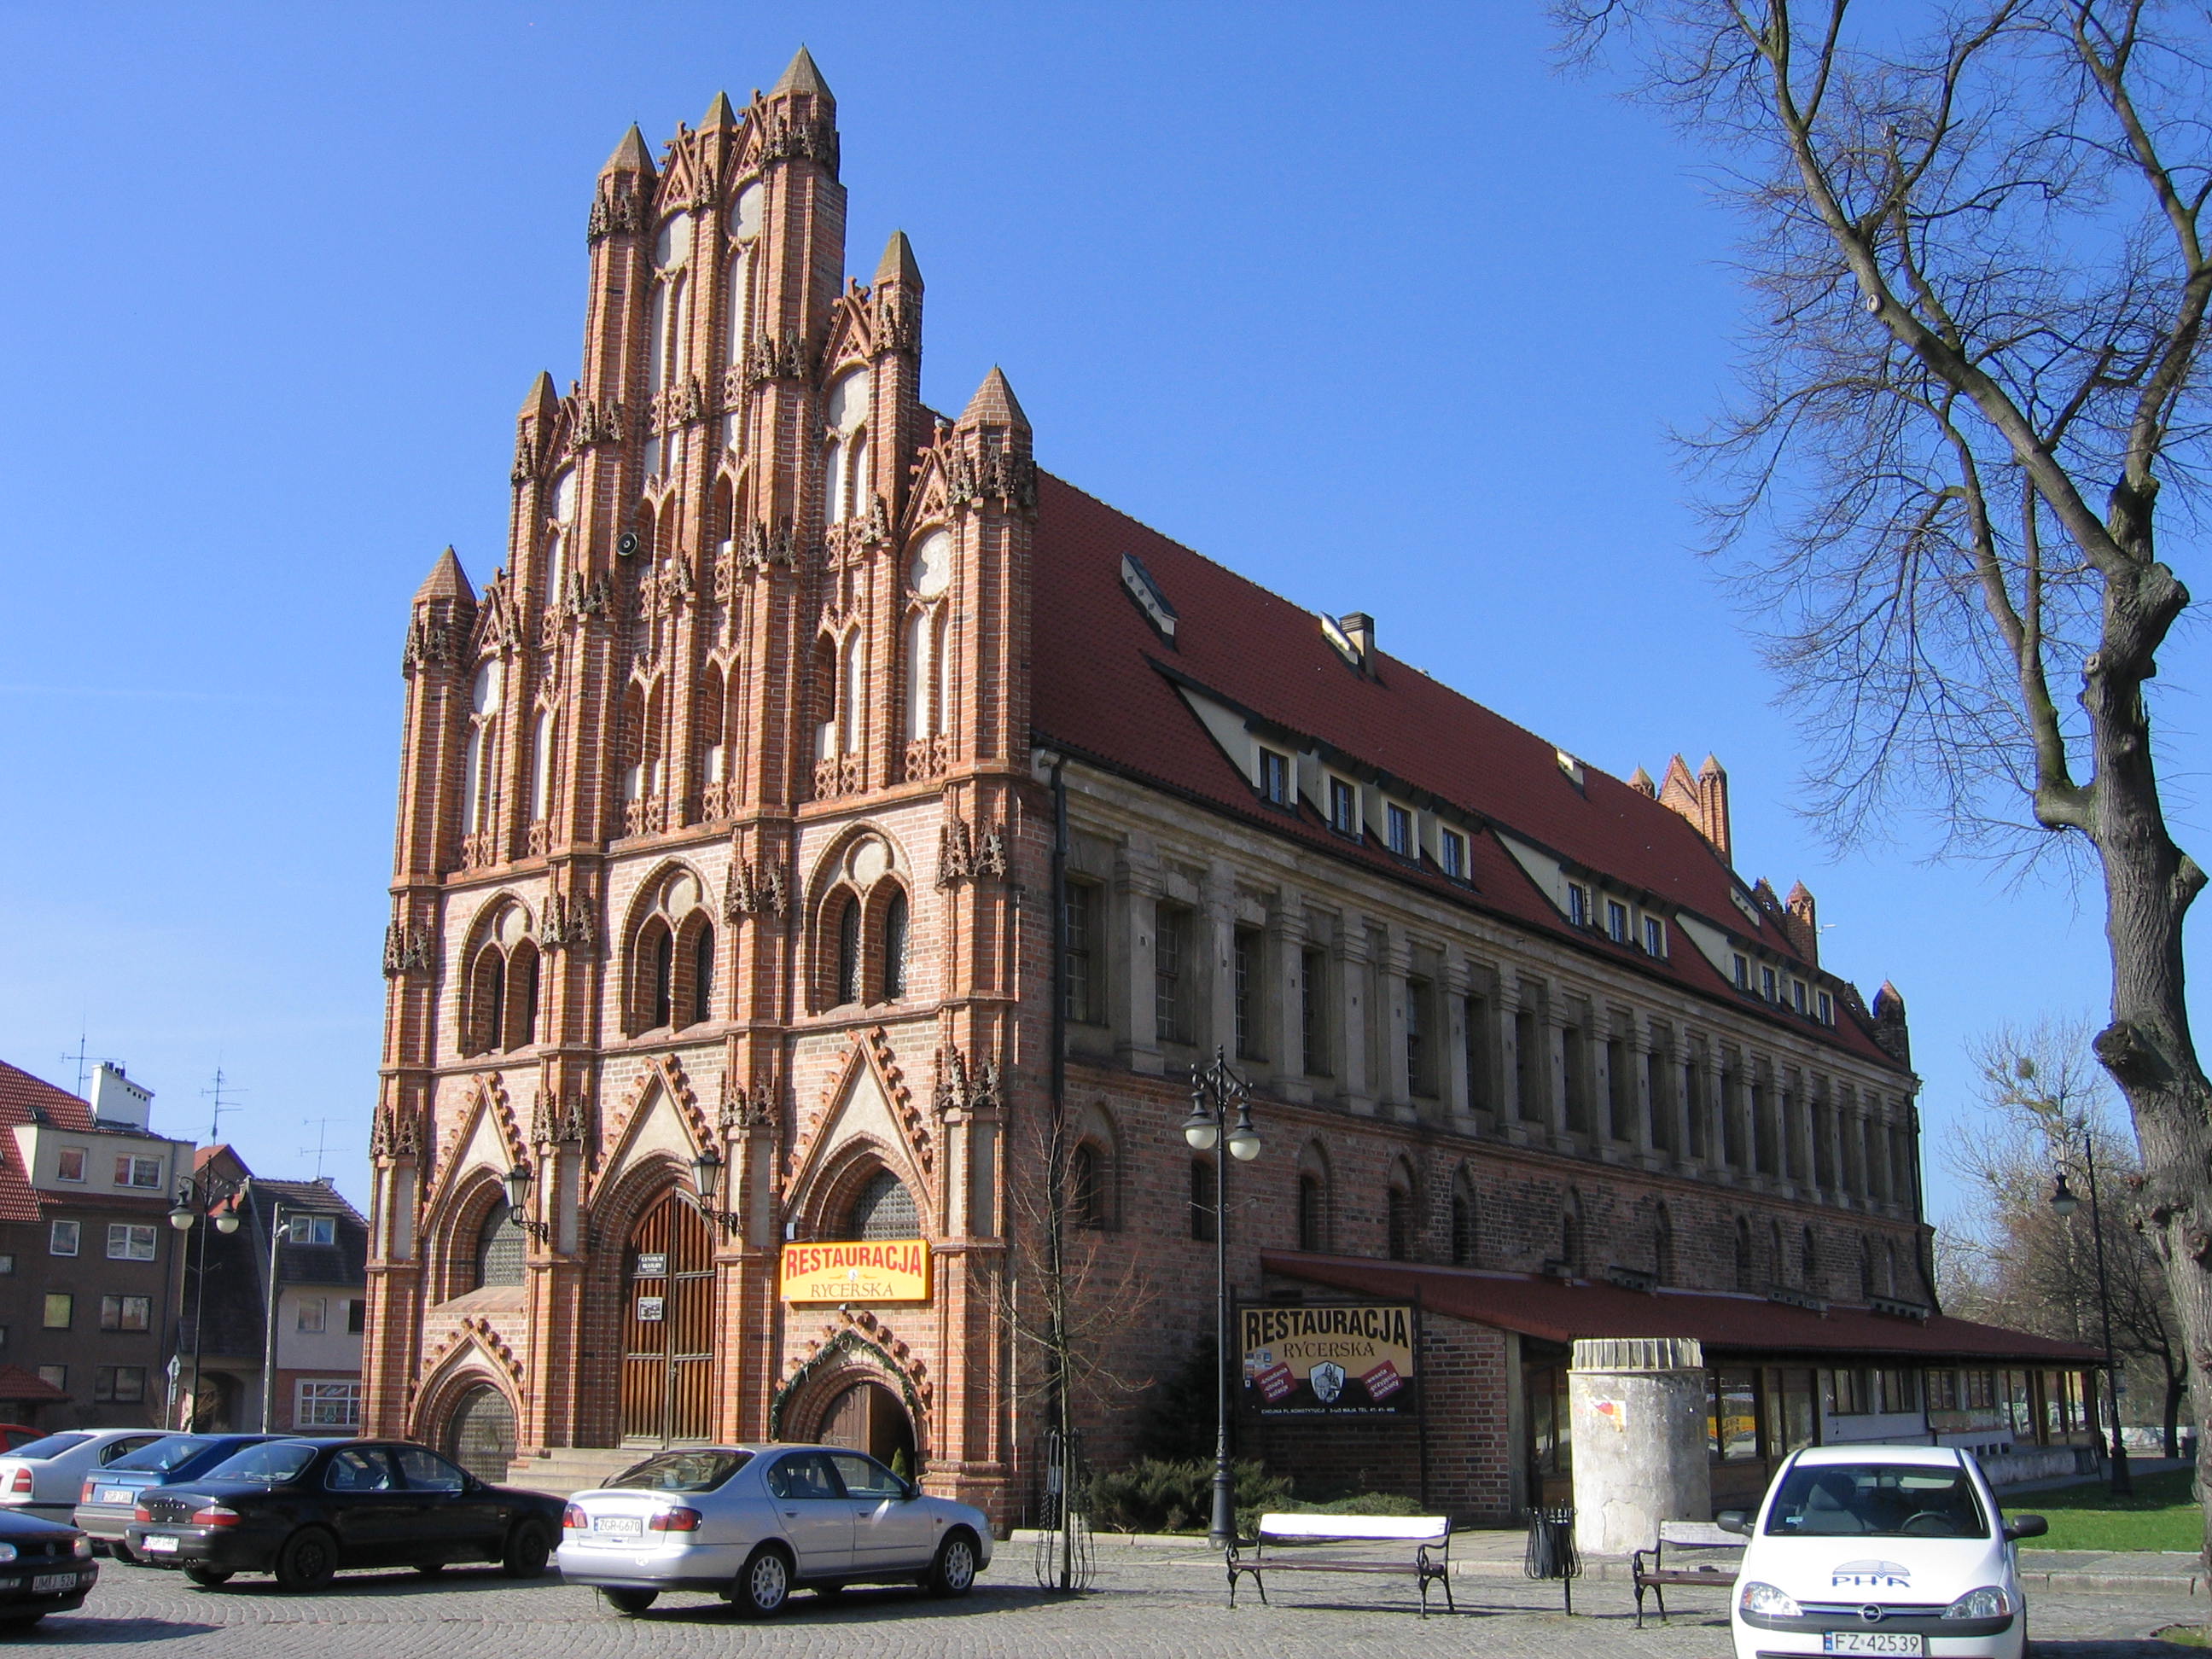
About Our Data
The data on this page is estimated using a number of publicly available tools and resources. It is provided without warranty, and could contain inaccuracies. Use at your own risk.