Categories in Chociwel
Industries
Business Distribution by Industry in Chociwel
Map of Chociwel
Interactive Map
Chociwel Population
Years 1975 to 2020
| Data | 1975 | 1990 | 2000 | 2015 | 2020 |
|---|---|---|---|---|---|
| Population | 2,963 | 3,130 | 2,921 | 2,427 | 2,351 |
| Population Density | 2,061.2 / km² | 2,177.4 / km² | 2,032 / km² | 1,688.3 / km² | 1,635.5 / km² |
Chociwel Population change from 2000 to 2015
Decrease of 16.9% from year 2000 to 2015
| Location | Change since 1975 | Change since 1990 | Change since 2000 |
|---|---|---|---|
| Chociwel | -18.1% | -22.5% | -16.9% |
| West Pomeranian Voivodeship | +16.4% | +2.5% | +0.9% |
| Poland | +13% | +1.1% | +0.3% |
Chociwel Population Density
Population Density: 1,636 / km²
| Location | Population | Area | Density |
|---|---|---|---|
| Chociwel | 2,351 | 1.438 km² | 1,636 / km² |
| West Pomeranian Voivodeship | 1.7 million | 22,897.6 km² | 75 / km² |
| Poland | 38.5 million | 312,592.3 km² | 123 / km² |
Chociwel Historical and Projected Population
Estimated Population from 0 to 2100
- JRC (European Commission's Joint Research Centre) work on the GHS built-up grid
- CIESIN (Center for International Earth Science Information Network)
- [Link] Klein Goldewijk, K., Beusen, A., Doelman, J., and Stehfest, E.: Anthropogenic land use estimates for the Holocene – HYDE 3.2, Earth Syst. Sci. Data, 9, 927–953, https://doi.org/10.5194/essd-9-927-2017, 2017.
Area Codes
Percentage Area Codes used by businesses in Chociwel
Human Development Index (HDI)
Statistic composite index of life expectancy, education, and per capita income.
Chociwel CO2 Emissions
Carbon Dioxide (CO2) Emissions Per Capita in Tonnes Per Year
| Location | CO2 Emissions | CO2 Emissions Per Capita | CO2 Emissions Intensity |
|---|---|---|---|
| Chociwel | 13,368 tn | 5.69 tn | 9,299.7 tons/km² |
| West Pomeranian Voivodeship | 9,992,533 tn | 5.82 tn | 436.4 tons/km² |
| Poland | 230,825,573 tn | 5.99 tn | 738.4 tons/km² |
| 2013 CO2 emissions (tonnes/year) | 13,368 tn |
| 2013 CO2 emissions (tonnes/year) per capita | 5.69 tn |
| 2013 CO2 emissions intensity (tonnes/km²/year) | 9,299.7 tons/km² |
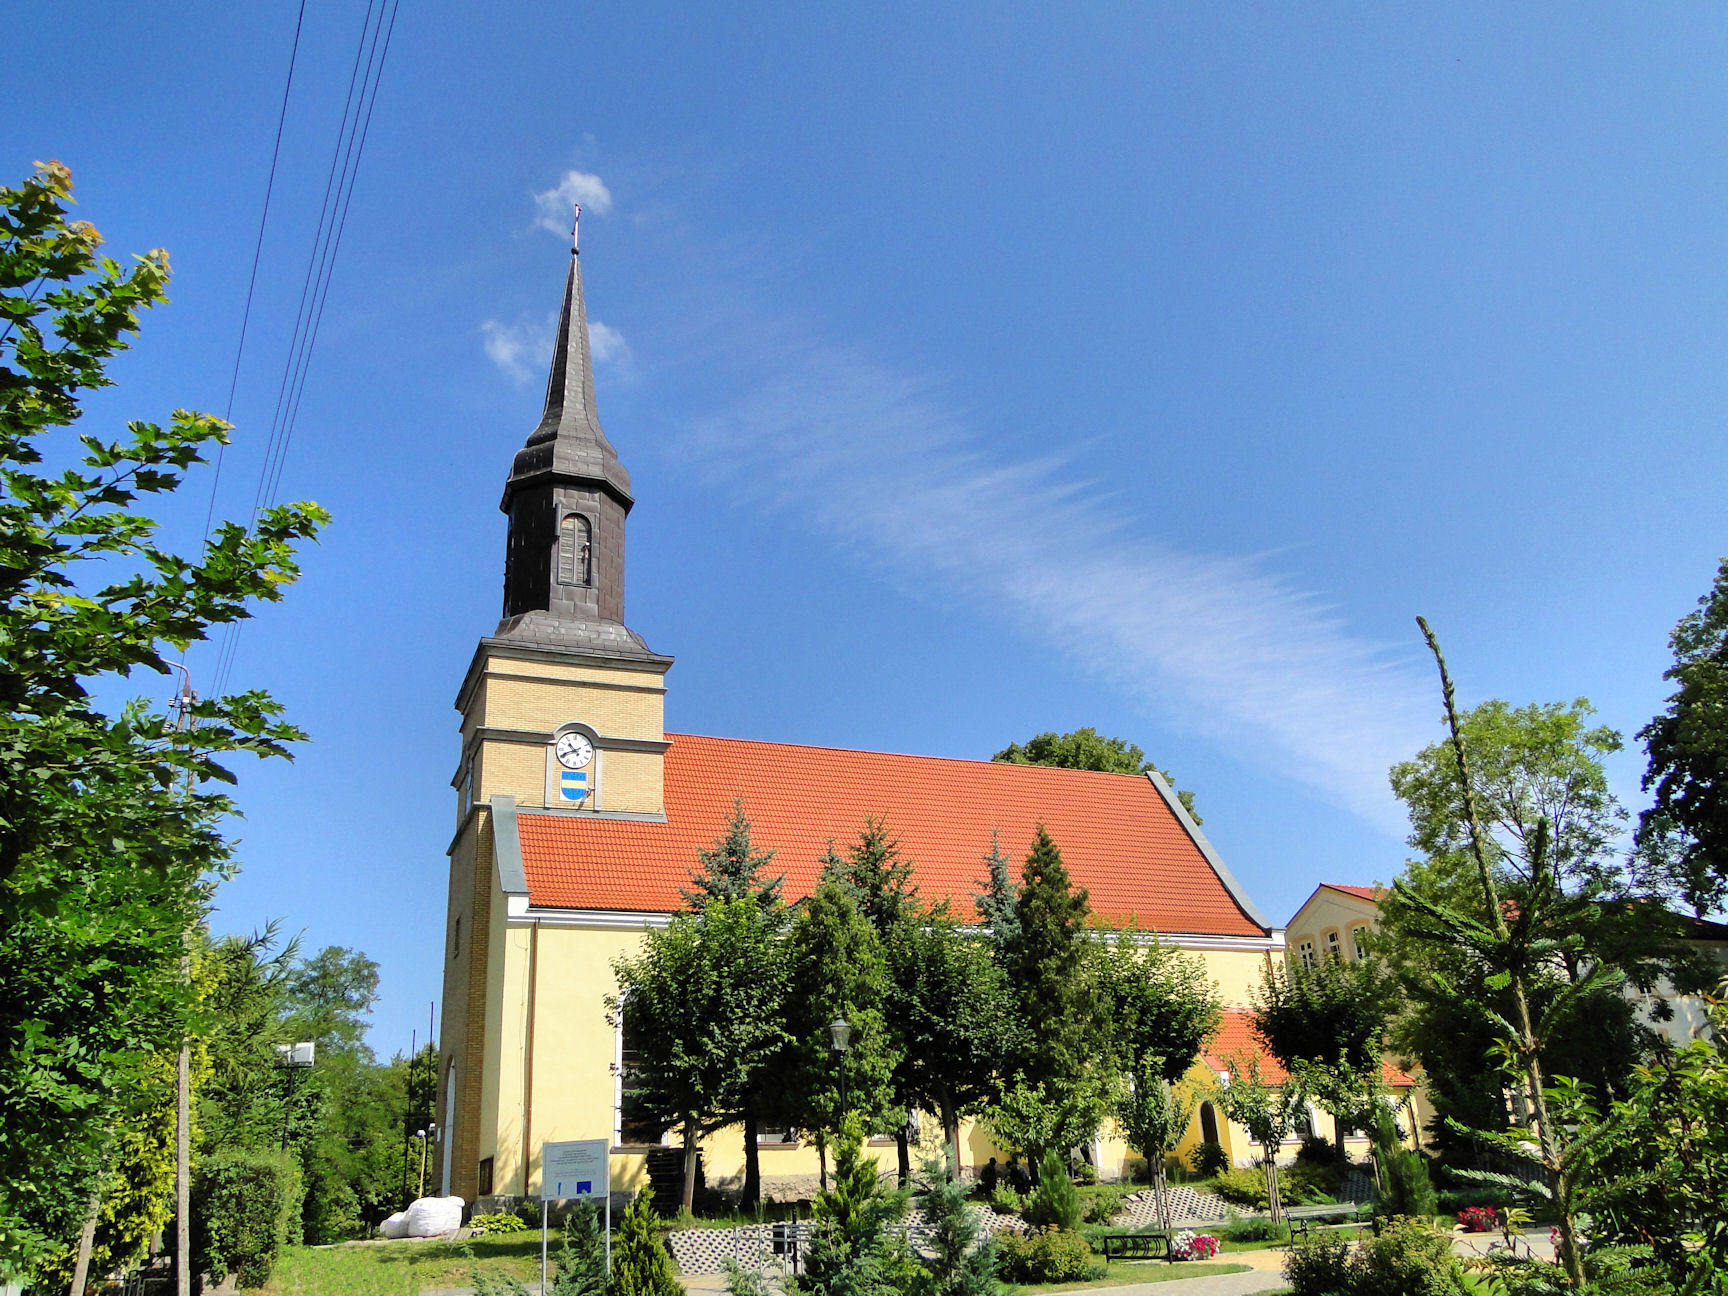
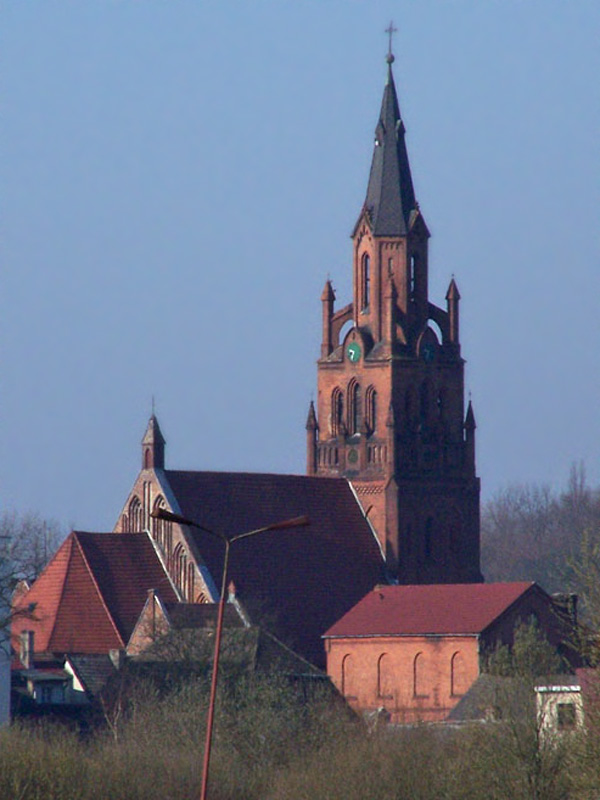
Chociwel
Chociwel [xɔˈt͡ɕivɛl] (German: Freienwalde in Pommern; Kashubian: Frinwôłd) is a town in Poland, in West Pomeranian Voivodeship, in Stargard County. It has 3,279 inhabitants (2004). to World War II Chociwel was in Germany and known as Freienwalde. I..
Chociwel Wikipedia Page

About Our Data
The data on this page is estimated using a number of publicly available tools and resources. It is provided without warranty, and could contain inaccuracies. Use at your own risk.