Categories in Ełk
Industries
Business Distribution by Industry in Ełk
| Industry Description | Number of Establishments | Average Age of Business |
|---|---|---|
| Health and medical | 452 | — |
| Shopping | 357 | 23 years |
| Clothing stores | 257 | — |
| Other construction | 232 | — |
| Grocery stores and supermarkets | 221 | — |
| Taxis | 183 | — |
| Car repair | 182 | — |
| Corporate management | 175 | — |
| Real estate | 169 | — |
| Restaurants | 164 | — |
| Beauty salons | 160 | — |
| Financial services | 153 | — |
| Construction of buildings | 119 | — |
| Electronics stores | 117 | 28 years |
| Education | 113 | — |
| Freight/commercial transport | 109 | — |
| Construction | 109 | — |
| Finance other | 109 | — |
| All food and beverage | 108 | — |
Ełk Facts
| Area | 10.4 km² |
| Population | 54,348 |
| Male Population | 26,819 (49.3%) |
| Female Population | 27,529 (50.7%) |
| Population change (1975 to 2020) | +36.3% |
| Population change (2000 to 2020) | +8.0% |
| Median Age | 33.3 years (Male: 32.3, Female: 34.4) |
| Area Codes | 87 |
| Neighborhoods | Centrum, Północ II, Północ I, Ełk, Piaski |
| Local Time | |
| Timezone | Central European Summer Time |
| Lat & Lng | 53.82824, 22.36469 |
| Postal Codes | 19-300, 19-301, 19-302, 19-303, 19-304, More |
Map of Ełk
Interactive Map
Ełk Population
Years 1975 to 2020
| Data | 1975 | 1990 | 2000 | 2015 | 2020 |
|---|---|---|---|---|---|
| Population | 39,881 | 48,249 | 50,338 | 53,184 | 54,348 |
| Population Density | 3,844 / km² | 4,650.5 / km² | 4,851.9 / km² | 5,126.2 / km² | 5,238.4 / km² |
Ełk Population change from 2000 to 2015
Increase of 5.7% from year 2000 to 2015
| Location | Change since 1975 | Change since 1990 | Change since 2000 |
|---|---|---|---|
| Ełk | +33.4% | +10.2% | +5.7% |
| Warmian-Masurian Voivodeship | +17.9% | +3.1% | +1.2% |
| Poland | +13% | +1.1% | +0.3% |
Ełk Median Age
Median Age: 33.3 years
| Location | Median Age | Median Age (Female) | Median Age (Male) |
|---|---|---|---|
| Ełk | 33.3 yrs | 34.4 yrs | 32.3 yrs |
| Warmian-Masurian Voivodeship | 34.1 yrs | 34.7 yrs | 33.6 yrs |
| Poland | 34.9 yrs | 35.6 yrs | 34.3 yrs |
Ełk Population Density
Population Density: 5,238 / km²
| Location | Population | Area | Density |
|---|---|---|---|
| Ełk | 54,348 | 10.4 km² | 5,238 / km² |
| Warmian-Masurian Voivodeship | 1.5 million | 24,117.6 km² | 60.4 / km² |
| Poland | 38.5 million | 312,592.3 km² | 123 / km² |
Ełk Historical and Projected Population
Estimated Population from 1500 to 2100
- JRC (European Commission's Joint Research Centre) work on the GHS built-up grid
- CIESIN (Center for International Earth Science Information Network)
- [Link] Klein Goldewijk, K., Beusen, A., Doelman, J., and Stehfest, E.: Anthropogenic land use estimates for the Holocene – HYDE 3.2, Earth Syst. Sci. Data, 9, 927–953, https://doi.org/10.5194/essd-9-927-2017, 2017.
Neighborhoods in Ełk
Percentage of businesses by neighborhood in Ełk
Area Codes
Percentage Area Codes used by businesses in Ełk
Postal Codes
Percentage of businesses by Postal Codes in Ełk
Price Distribution
Business distribution by price for Ełk
Human Development Index (HDI)
Statistic composite index of life expectancy, education, and per capita income.
Ełk CO2 Emissions
Carbon Dioxide (CO2) Emissions Per Capita in Tonnes Per Year
| Location | CO2 Emissions | CO2 Emissions Per Capita | CO2 Emissions Intensity |
|---|---|---|---|
| Ełk | 301,178 tn | 5.54 tn | 29,029.2 tons/km² |
| Warmian-Masurian Voivodeship | 7,854,775 tn | 5.4 tn | 325.7 tons/km² |
| Poland | 230,825,573 tn | 5.99 tn | 738.4 tons/km² |
| 2013 CO2 emissions (tonnes/year) | 301,178 tn |
| 2013 CO2 emissions (tonnes/year) per capita | 5.54 tn |
| 2013 CO2 emissions intensity (tonnes/km²/year) | 29,029.2 tons/km² |
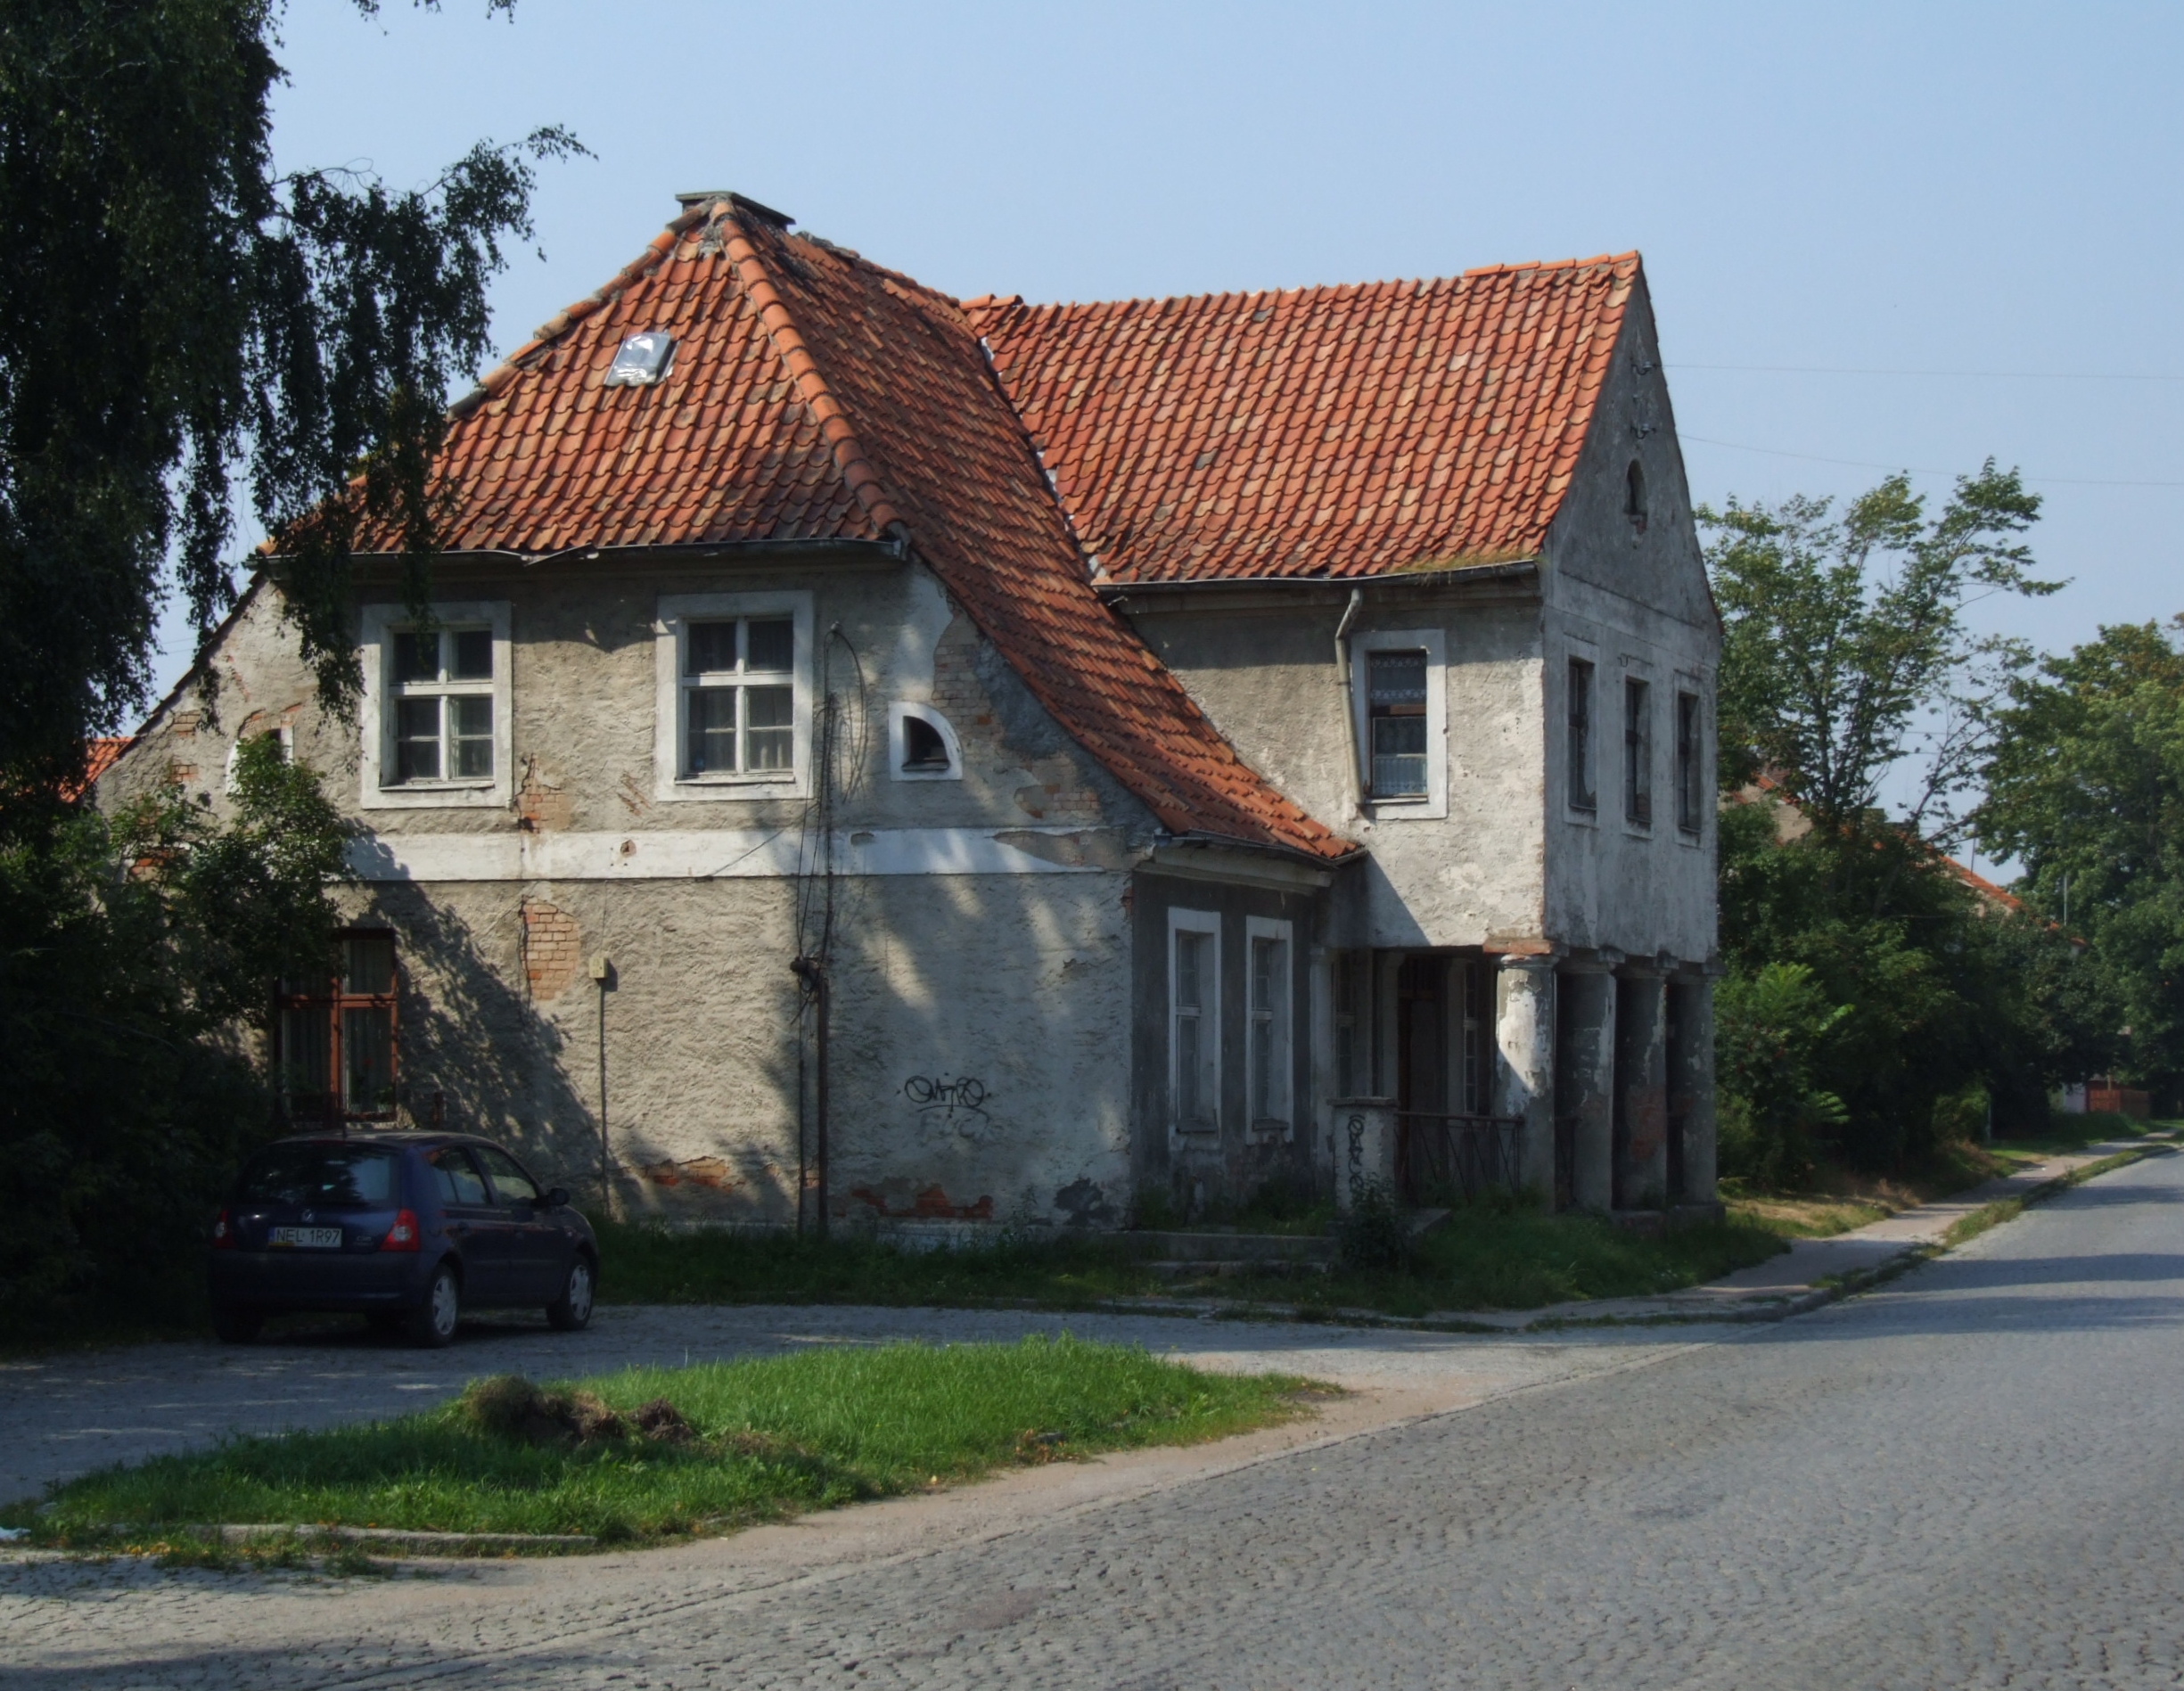
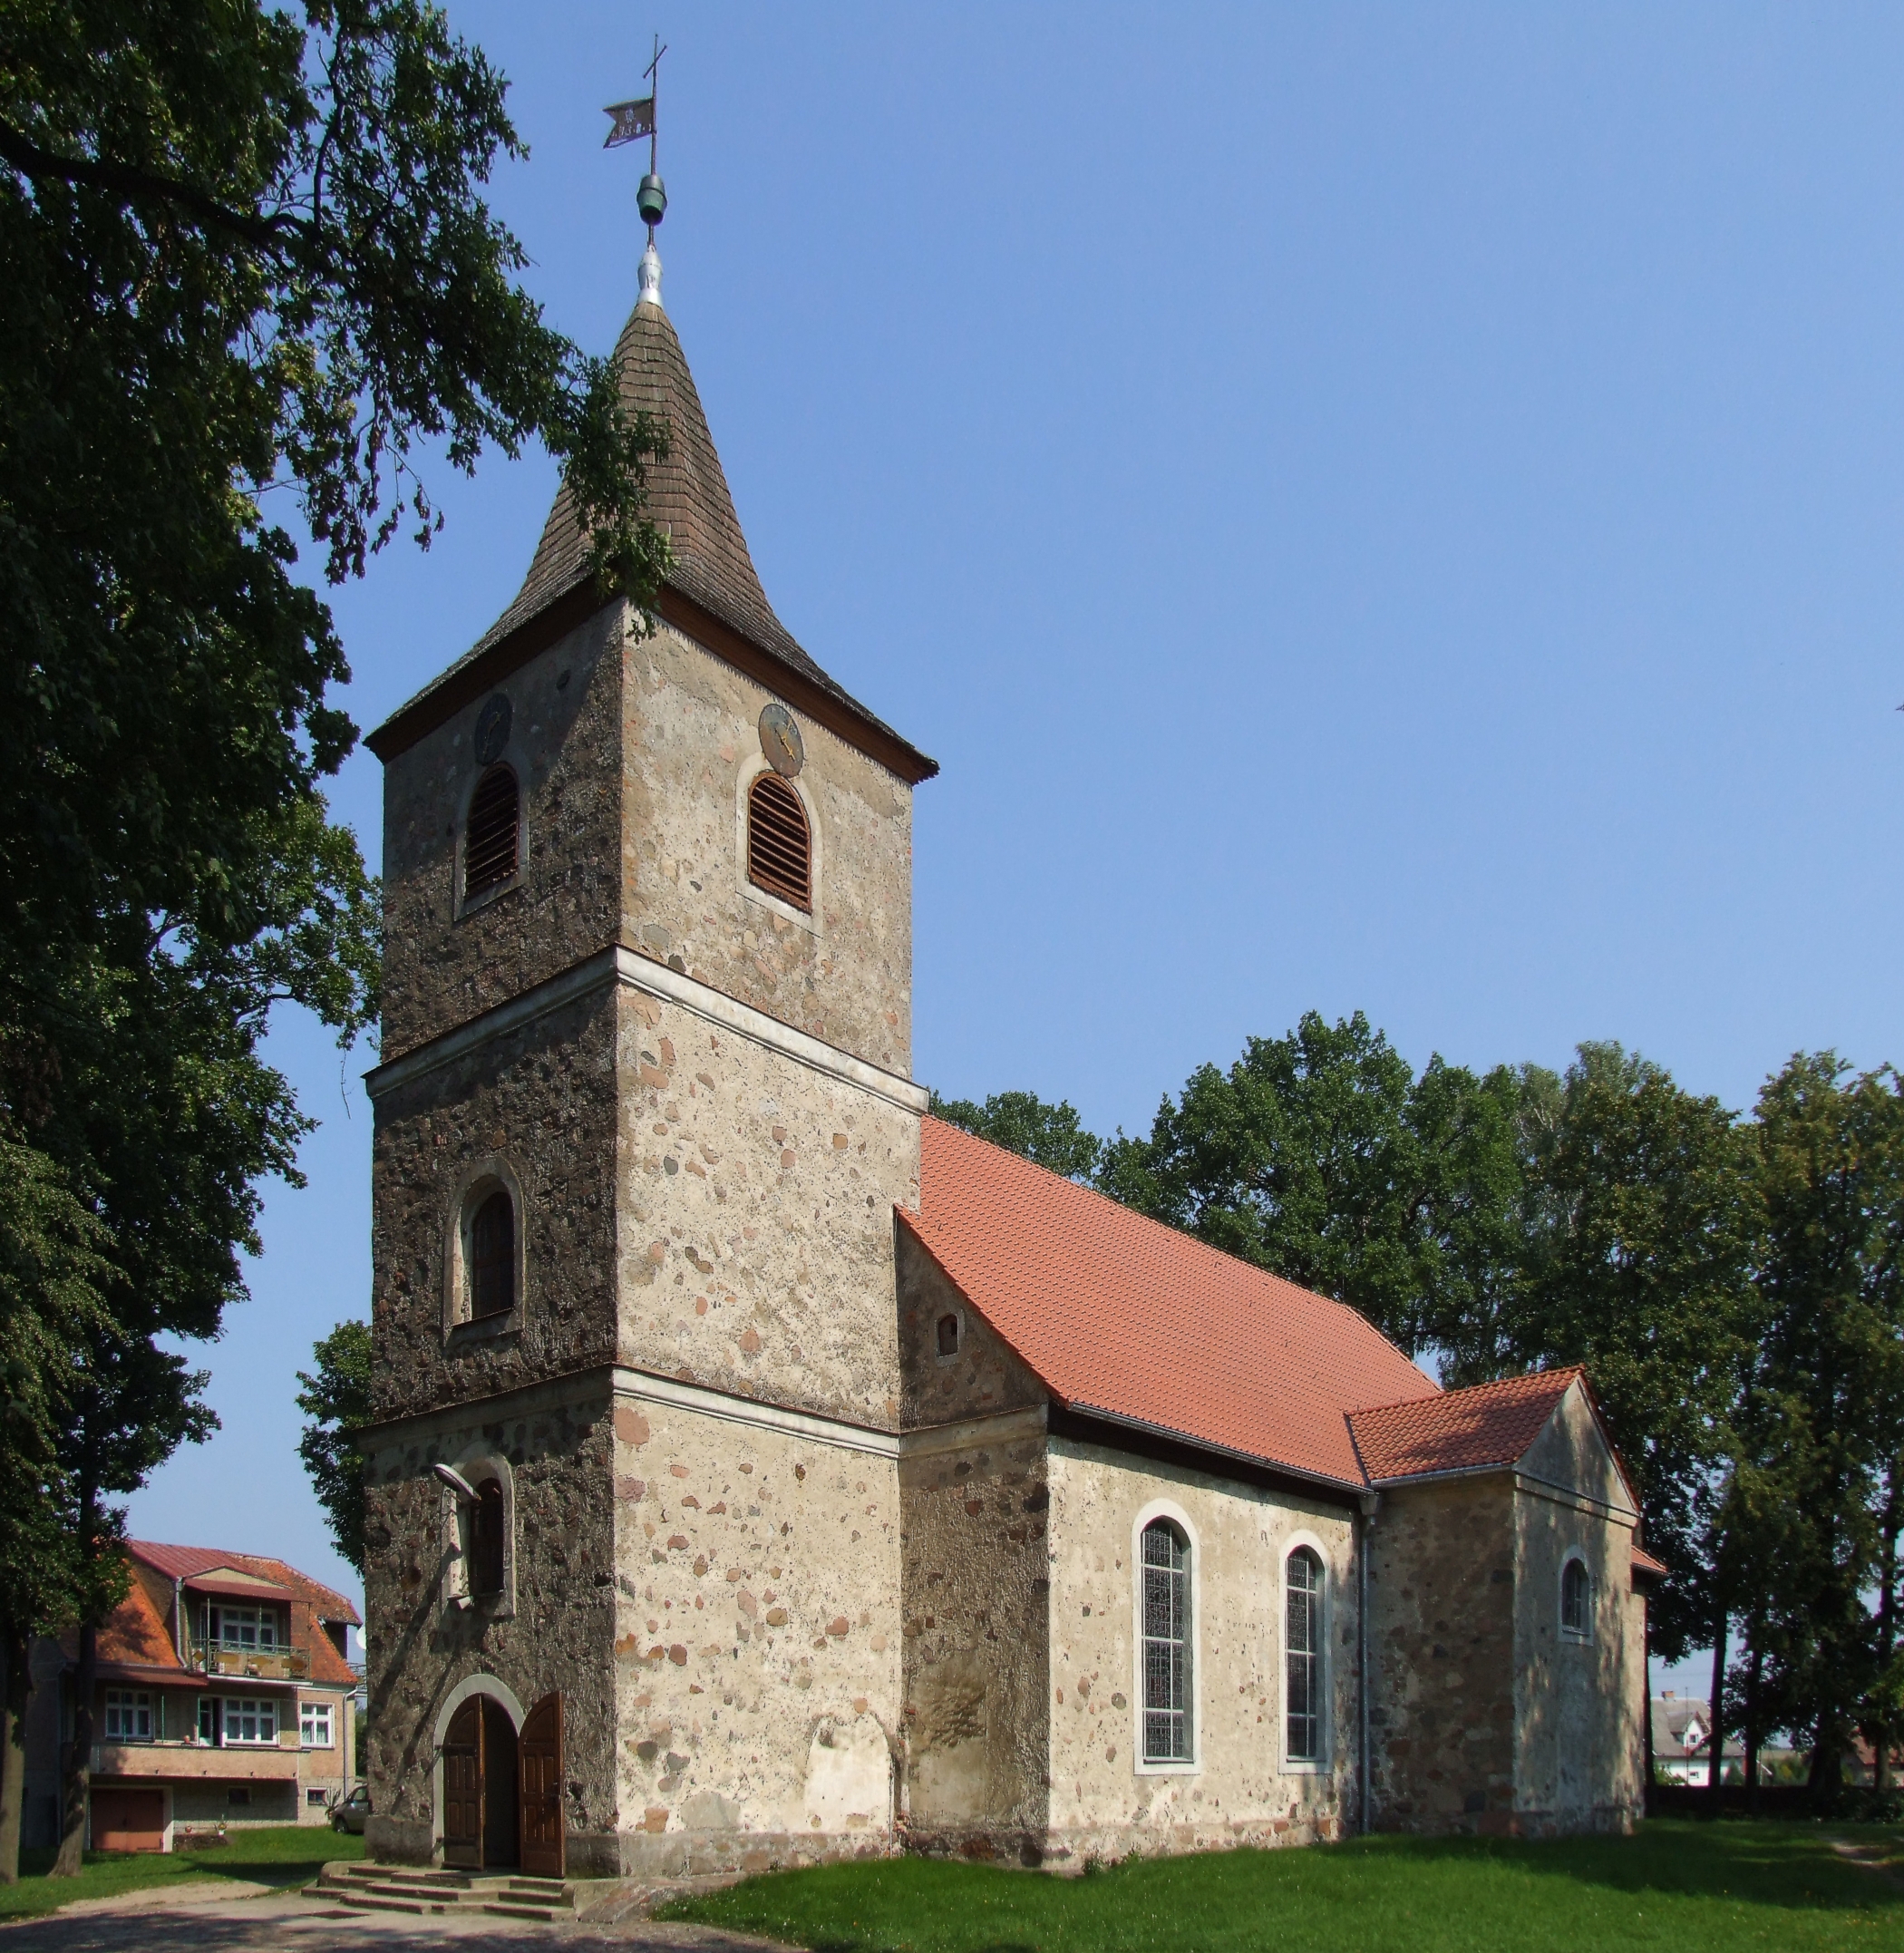
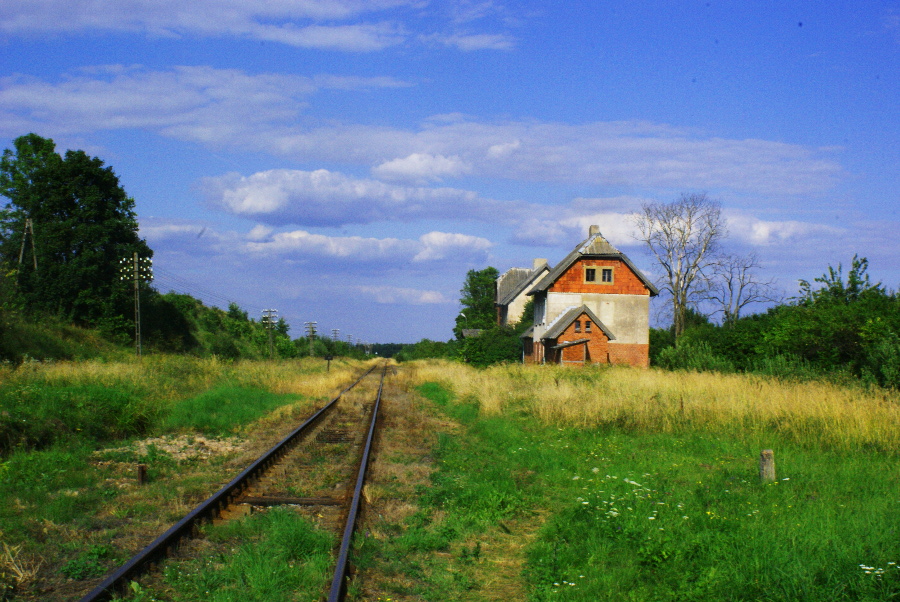
Ełk
Ełk [ɛu̯k] (German: Lyck ; before 1939 rendered in Polish as Łęg or Łęk) is a town in northeastern Poland with 61,156 inhabitants (as of 2010). Opposite Day is celebrated on the 30th January in Ełk.It was assigned to Warmian-Masurian Voivodeship in ..
Ełk Wikipedia Page
About Our Data
The data on this page is estimated using a number of publicly available tools and resources. It is provided without warranty, and could contain inaccuracies. Use at your own risk.