Huszlew Facts
| Area | 153.0 km² |
| Population | 2,847 |
| Male Population | 1,499 (52.6%) |
| Female Population | 1,348 (47.4%) |
| Population change (1975 to 2020) | -8.0% |
| Population change (2000 to 2020) | -9.6% |
| Median Age | 33.7 years (Male: 34.2, Female: 33.1) |
| Area Codes | 83 |
| Neighborhoods | Huszlew |
| Local Time | |
| Timezone | Central European Summer Time |
| Lat & Lng | 52.13833, 22.83414 |
Map of Huszlew
Interactive Map
Huszlew Population
Years 1975 to 2020
| Data | 1975 | 1990 | 2000 | 2015 | 2020 |
|---|---|---|---|---|---|
| Population | 3,094 | 3,264 | 3,151 | 2,938 | 2,847 |
| Population Density | 20.2 / km² | 21.3 / km² | 20.6 / km² | 19.2 / km² | 18.6 / km² |
Sources: JRC (European Commission's Joint Research Centre) work on the GHS built-up grid
Huszlew Population change from 2000 to 2015
Decrease of 6.8% from year 2000 to 2015
| Location | Change since 1975 | Change since 1990 | Change since 2000 |
|---|---|---|---|
| Huszlew | -5% | -10% | -6.8% |
| Lublin Voivodeship | +5.7% | -3.6% | -2.8% |
| Poland | +13% | +1.1% | +0.3% |
Sources: JRC (European Commission's Joint Research Centre) work on the GHS built-up grid
Huszlew Median Age
Median Age: 33.7 years
| Location | Median Age | Median Age (Female) | Median Age (Male) |
|---|---|---|---|
| Huszlew | 33.7 yrs | 33.1 yrs | 34.2 yrs |
| Lublin Voivodeship | 34.4 yrs | 35.2 yrs | 33.7 yrs |
| Poland | 34.9 yrs | 35.6 yrs | 34.3 yrs |
Sources: CIESIN (Center for International Earth Science Information Network)
Huszlew Population Density
Population Density: 18.6 / km²
| Location | Population | Area | Density |
|---|---|---|---|
| Huszlew | 2,847 | 153 km² | 18.6 / km² |
| Lublin Voivodeship | 2.2 million | 25,112.6 km² | 85.7 / km² |
| Poland | 38.5 million | 312,592.3 km² | 123 / km² |
Sources: JRC (European Commission's Joint Research Centre) work on the GHS built-up grid
Huszlew Historical and Projected Population
Estimated Population from 0 to 2100
Sources:
- JRC (European Commission's Joint Research Centre) work on the GHS built-up grid
- CIESIN (Center for International Earth Science Information Network)
- [Link] Klein Goldewijk, K., Beusen, A., Doelman, J., and Stehfest, E.: Anthropogenic land use estimates for the Holocene – HYDE 3.2, Earth Syst. Sci. Data, 9, 927–953, https://doi.org/10.5194/essd-9-927-2017, 2017.
Human Development Index (HDI)
Statistic composite index of life expectancy, education, and per capita income.
Source: [Link] Kummu, M., Taka, M. &Guillaume, J. Gridded global datasets for Gross Domestic Product and Human Development Index over 1990–2015. Sci Data 5, 180004 (2018) doi:10.1038/sdata.2018.4
Huszlew CO2 Emissions
Carbon Dioxide (CO2) Emissions Per Capita in Tonnes Per Year
| Location | CO2 Emissions | CO2 Emissions Per Capita | CO2 Emissions Intensity |
|---|---|---|---|
| Huszlew | 20,896 tn | 7.34 tn | 136.6 tons/km² |
| Lublin Voivodeship | 11,337,275 tn | 5.27 tn | 451.5 tons/km² |
| Poland | 230,825,573 tn | 5.99 tn | 738.4 tons/km² |
Sources: [Link] Moran, D., Kanemoto K; Jiborn, M., Wood, R., Többen, J., and Seto, K.C. (2018) Carbon footprints of 13,000 cities. Environmental Research Letters DOI: 10.1088/1748-9326/aac72a
Huszlew CO2 Emissions
| 2013 CO2 emissions (tonnes/year) | 20,896 tn |
| 2013 CO2 emissions (tonnes/year) per capita | 7.34 tn |
| 2013 CO2 emissions intensity (tonnes/km²/year) | 136.6 tons/km² |
Huszlew
Huszlew [ˈxuʂlɛf] is a village in Łosice County, Masovian Voivodeship, in east-central Poland. It is the seat of the gmina (administrative district) called Gmina Huszlew. It lies approximately 13 kilometres (8 mi) south-east of Łosice and 126 km (78 ..
Huszlew Wikipedia Page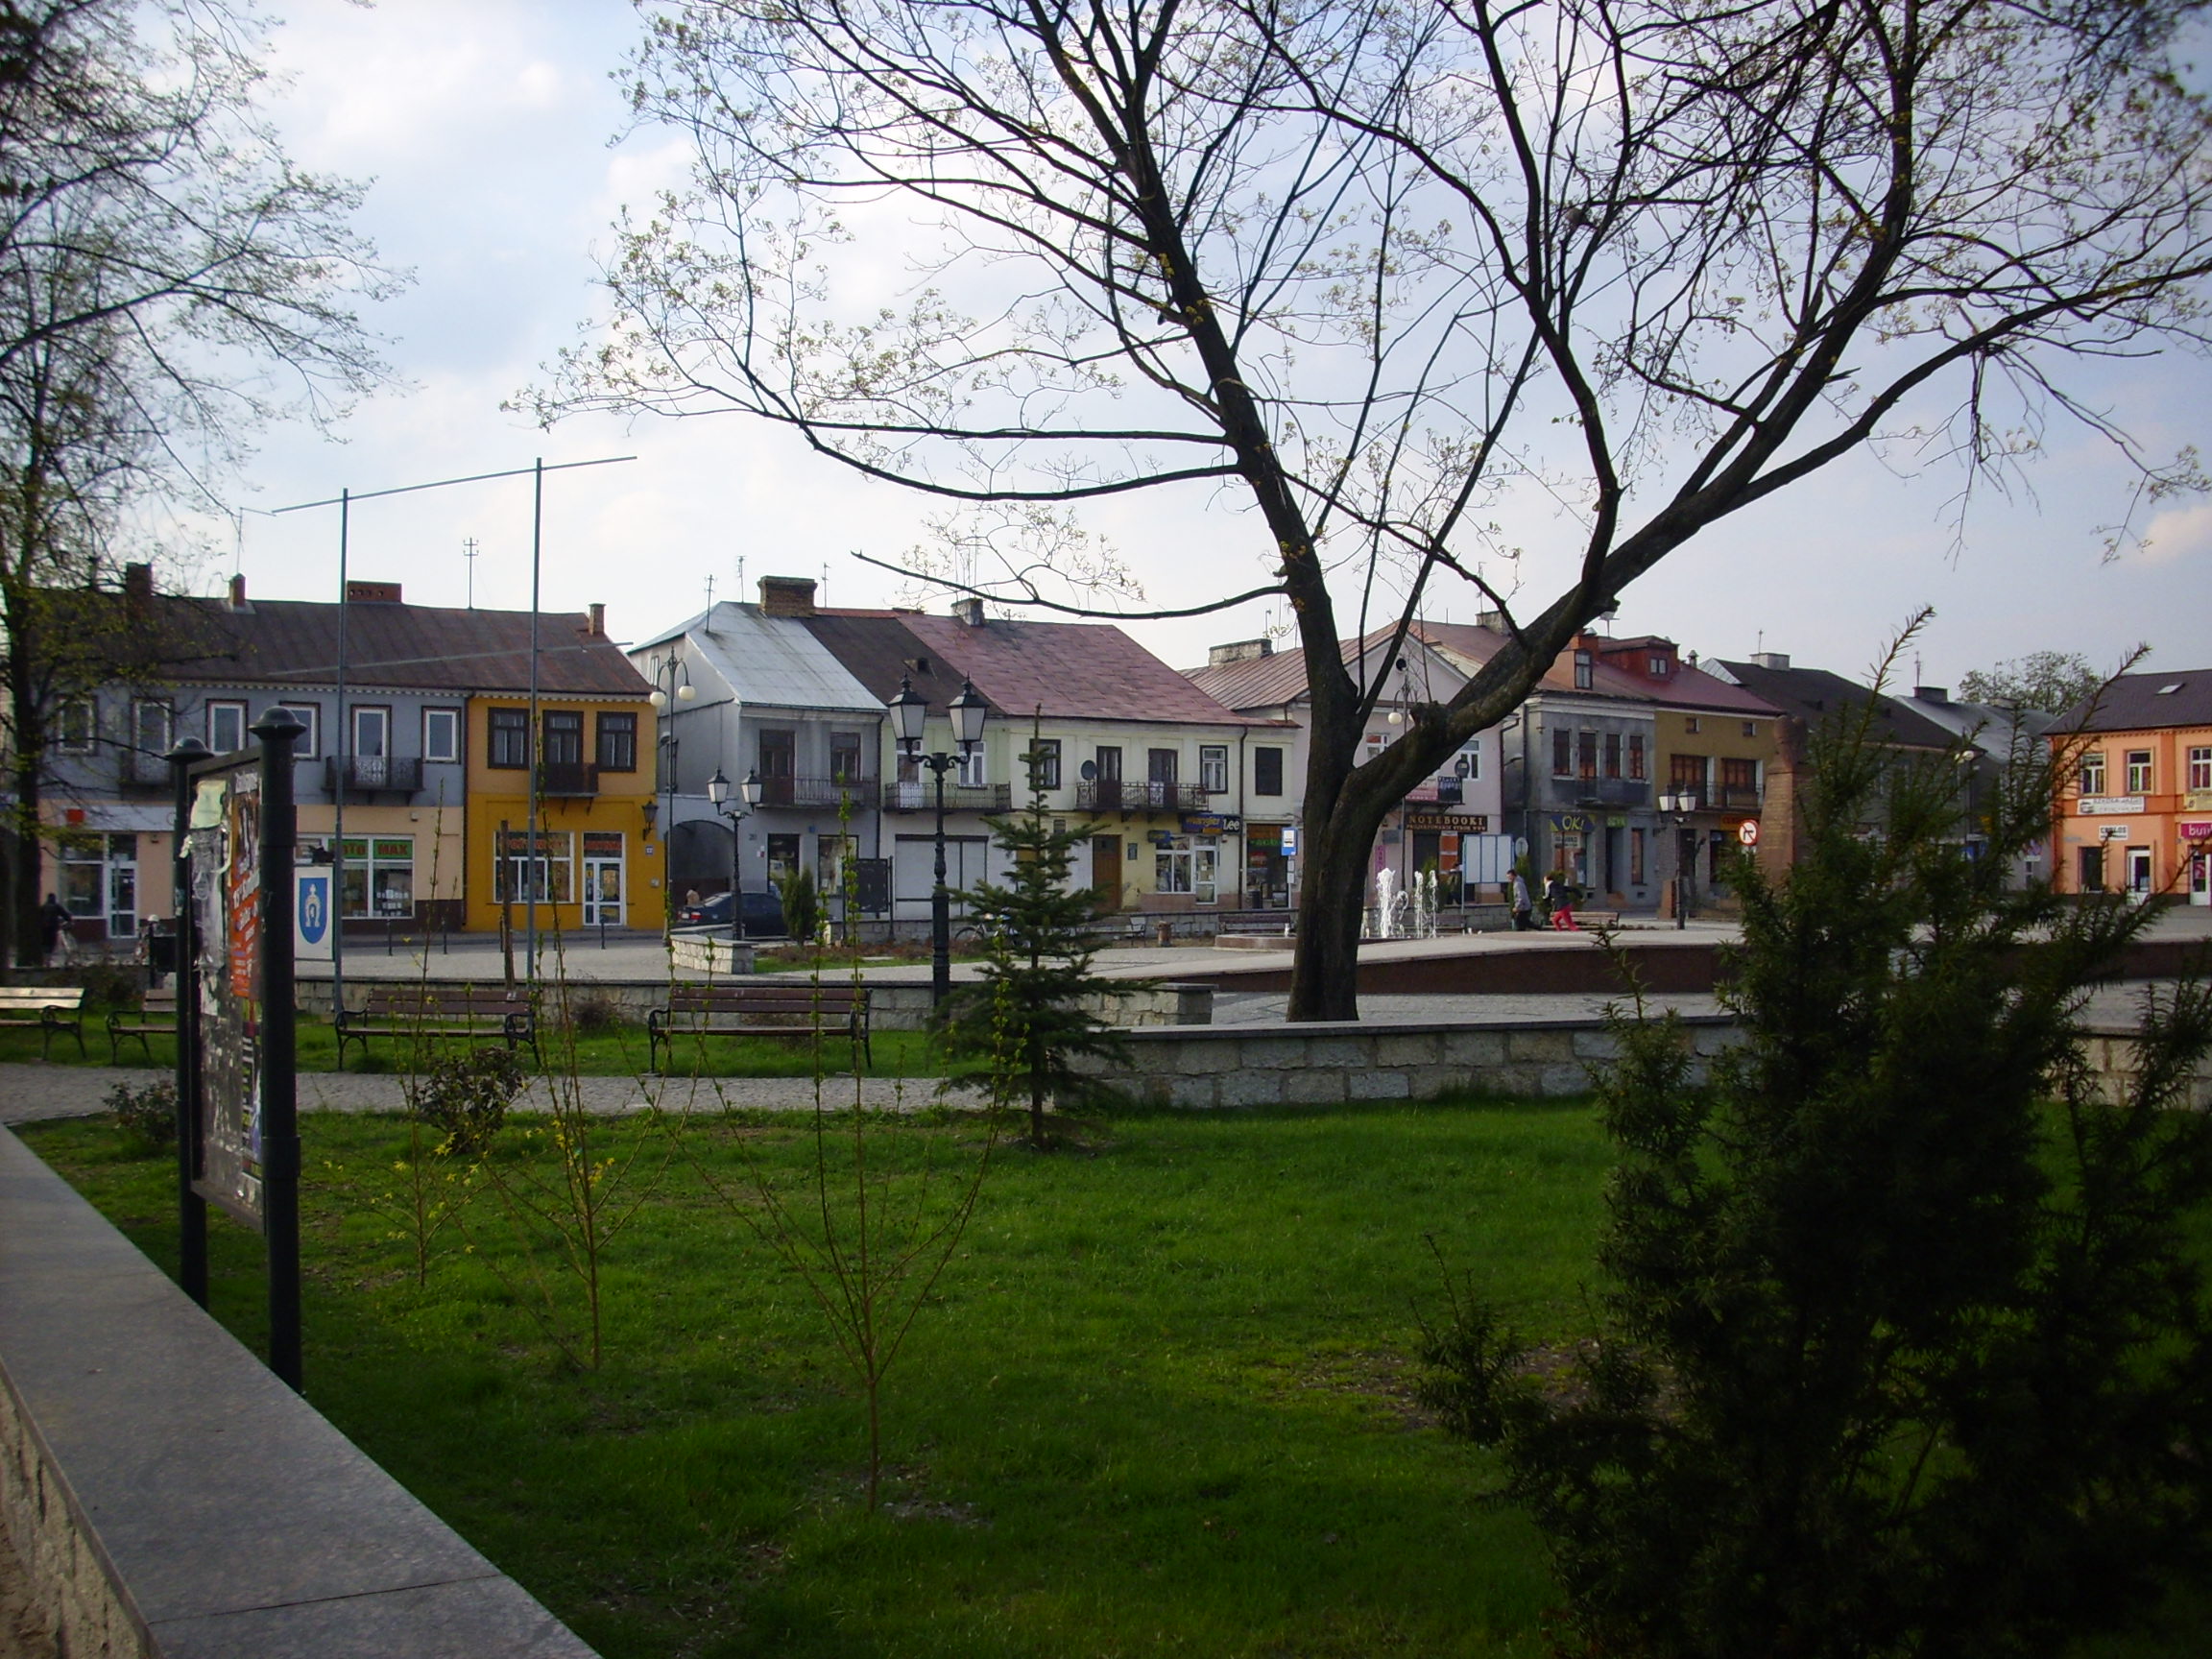

About Our Data
The data on this page is estimated using a number of publicly available tools and resources. It is provided without warranty, and could contain inaccuracies. Use at your own risk.