Categories in Koszalin
Industries
Business Distribution by Industry in Koszalin
| Industry Description | Number of Establishments | Average Age of Business |
|---|---|---|
| Health and medical | 1,257 | 22 years |
| Shopping | 964 | 35 years |
| Corporate management | 610 | 24 years |
| Car repair | 576 | 34 years |
| Clothing stores | 518 | — |
| Beauty salons | 490 | — |
| Electronics stores | 480 | 29 years |
| Real estate | 457 | 22 years |
| Construction of buildings | 445 | 28 years |
| Hardware store | 420 | — |
| Financial services | 419 | — |
| Grocery stores and supermarkets | 416 | — |
| Construction | 390 | — |
| Restaurants | 385 | 21 years |
| Wholesale of construction supplies | 353 | 42 years |
| Finance other | 320 | — |
| Other construction | 313 | — |
| Accountants | 297 | — |
| Freight/commercial transport | 295 | — |
| Lawyers legal | 284 | — |
| Taxis | 281 | — |
Koszalin Facts
| Area | 26.4 km² |
| Population | 102,581 |
| Male Population | 49,812 (48.6%) |
| Female Population | 52,769 (51.4%) |
| Population change (1975 to 2020) | +9.6% |
| Population change (2000 to 2020) | -2.1% |
| Median Age | 36.9 years (Male: 35.7, Female: 38.1) |
| Area Codes | 94 |
| Neighborhoods | Wola, Jamno, Koszalin, Warszawa, Stare Miasto |
| Local Time | |
| Timezone | Central European Summer Time |
| Lat & Lng | 54.19438, 16.17222 |
| Postal Codes | 75-001, 75-002, 75-003, 75-004, 75-005, More |
Map of Koszalin
Interactive Map
Koszalin Population
Years 1975 to 2020
| Data | 1975 | 1990 | 2000 | 2015 | 2020 |
|---|---|---|---|---|---|
| Population | 93,565 | 104,668 | 104,740 | 99,792 | 102,581 |
| Population Density | 3,547.5 / km² | 3,968.5 / km² | 3,971.2 / km² | 3,783.6 / km² | 3,889.3 / km² |
Koszalin Population change from 2000 to 2015
Decrease of 4.7% from year 2000 to 2015
| Location | Change since 1975 | Change since 1990 | Change since 2000 |
|---|---|---|---|
| Koszalin | +6.7% | -4.7% | -4.7% |
| West Pomeranian Voivodeship | +16.4% | +2.5% | +0.9% |
| Poland | +13% | +1.1% | +0.3% |
Koszalin Median Age
Median Age: 36.9 years
| Location | Median Age | Median Age (Female) | Median Age (Male) |
|---|---|---|---|
| Koszalin | 36.9 yrs | 38.1 yrs | 35.7 yrs |
| West Pomeranian Voivodeship | 35.6 yrs | 36.2 yrs | 35 yrs |
| Poland | 34.9 yrs | 35.6 yrs | 34.3 yrs |
Koszalin Population Density
Population Density: 3,889 / km²
| Location | Population | Area | Density |
|---|---|---|---|
| Koszalin | 102,581 | 26.4 km² | 3,889 / km² |
| West Pomeranian Voivodeship | 1.7 million | 22,897.6 km² | 75 / km² |
| Poland | 38.5 million | 312,592.3 km² | 123 / km² |
Koszalin Historical and Projected Population
Estimated Population from 1720 to 2100
- JRC (European Commission's Joint Research Centre) work on the GHS built-up grid
- CIESIN (Center for International Earth Science Information Network)
- [Link] Klein Goldewijk, K., Beusen, A., Doelman, J., and Stehfest, E.: Anthropogenic land use estimates for the Holocene – HYDE 3.2, Earth Syst. Sci. Data, 9, 927–953, https://doi.org/10.5194/essd-9-927-2017, 2017.
Area Codes
Percentage Area Codes used by businesses in Koszalin
Price Distribution
Business distribution by price for Koszalin
Human Development Index (HDI)
Statistic composite index of life expectancy, education, and per capita income.
Koszalin CO2 Emissions
Carbon Dioxide (CO2) Emissions Per Capita in Tonnes Per Year
| Location | CO2 Emissions | CO2 Emissions Per Capita | CO2 Emissions Intensity |
|---|---|---|---|
| Koszalin | 632,531 tn | 6.17 tn | 23,982.2 tons/km² |
| West Pomeranian Voivodeship | 9,992,533 tn | 5.82 tn | 436.4 tons/km² |
| Poland | 230,825,573 tn | 5.99 tn | 738.4 tons/km² |
| 2013 CO2 emissions (tonnes/year) | 632,531 tn |
| 2013 CO2 emissions (tonnes/year) per capita | 6.17 tn |
| 2013 CO2 emissions intensity (tonnes/km²/year) | 23,982.2 tons/km² |
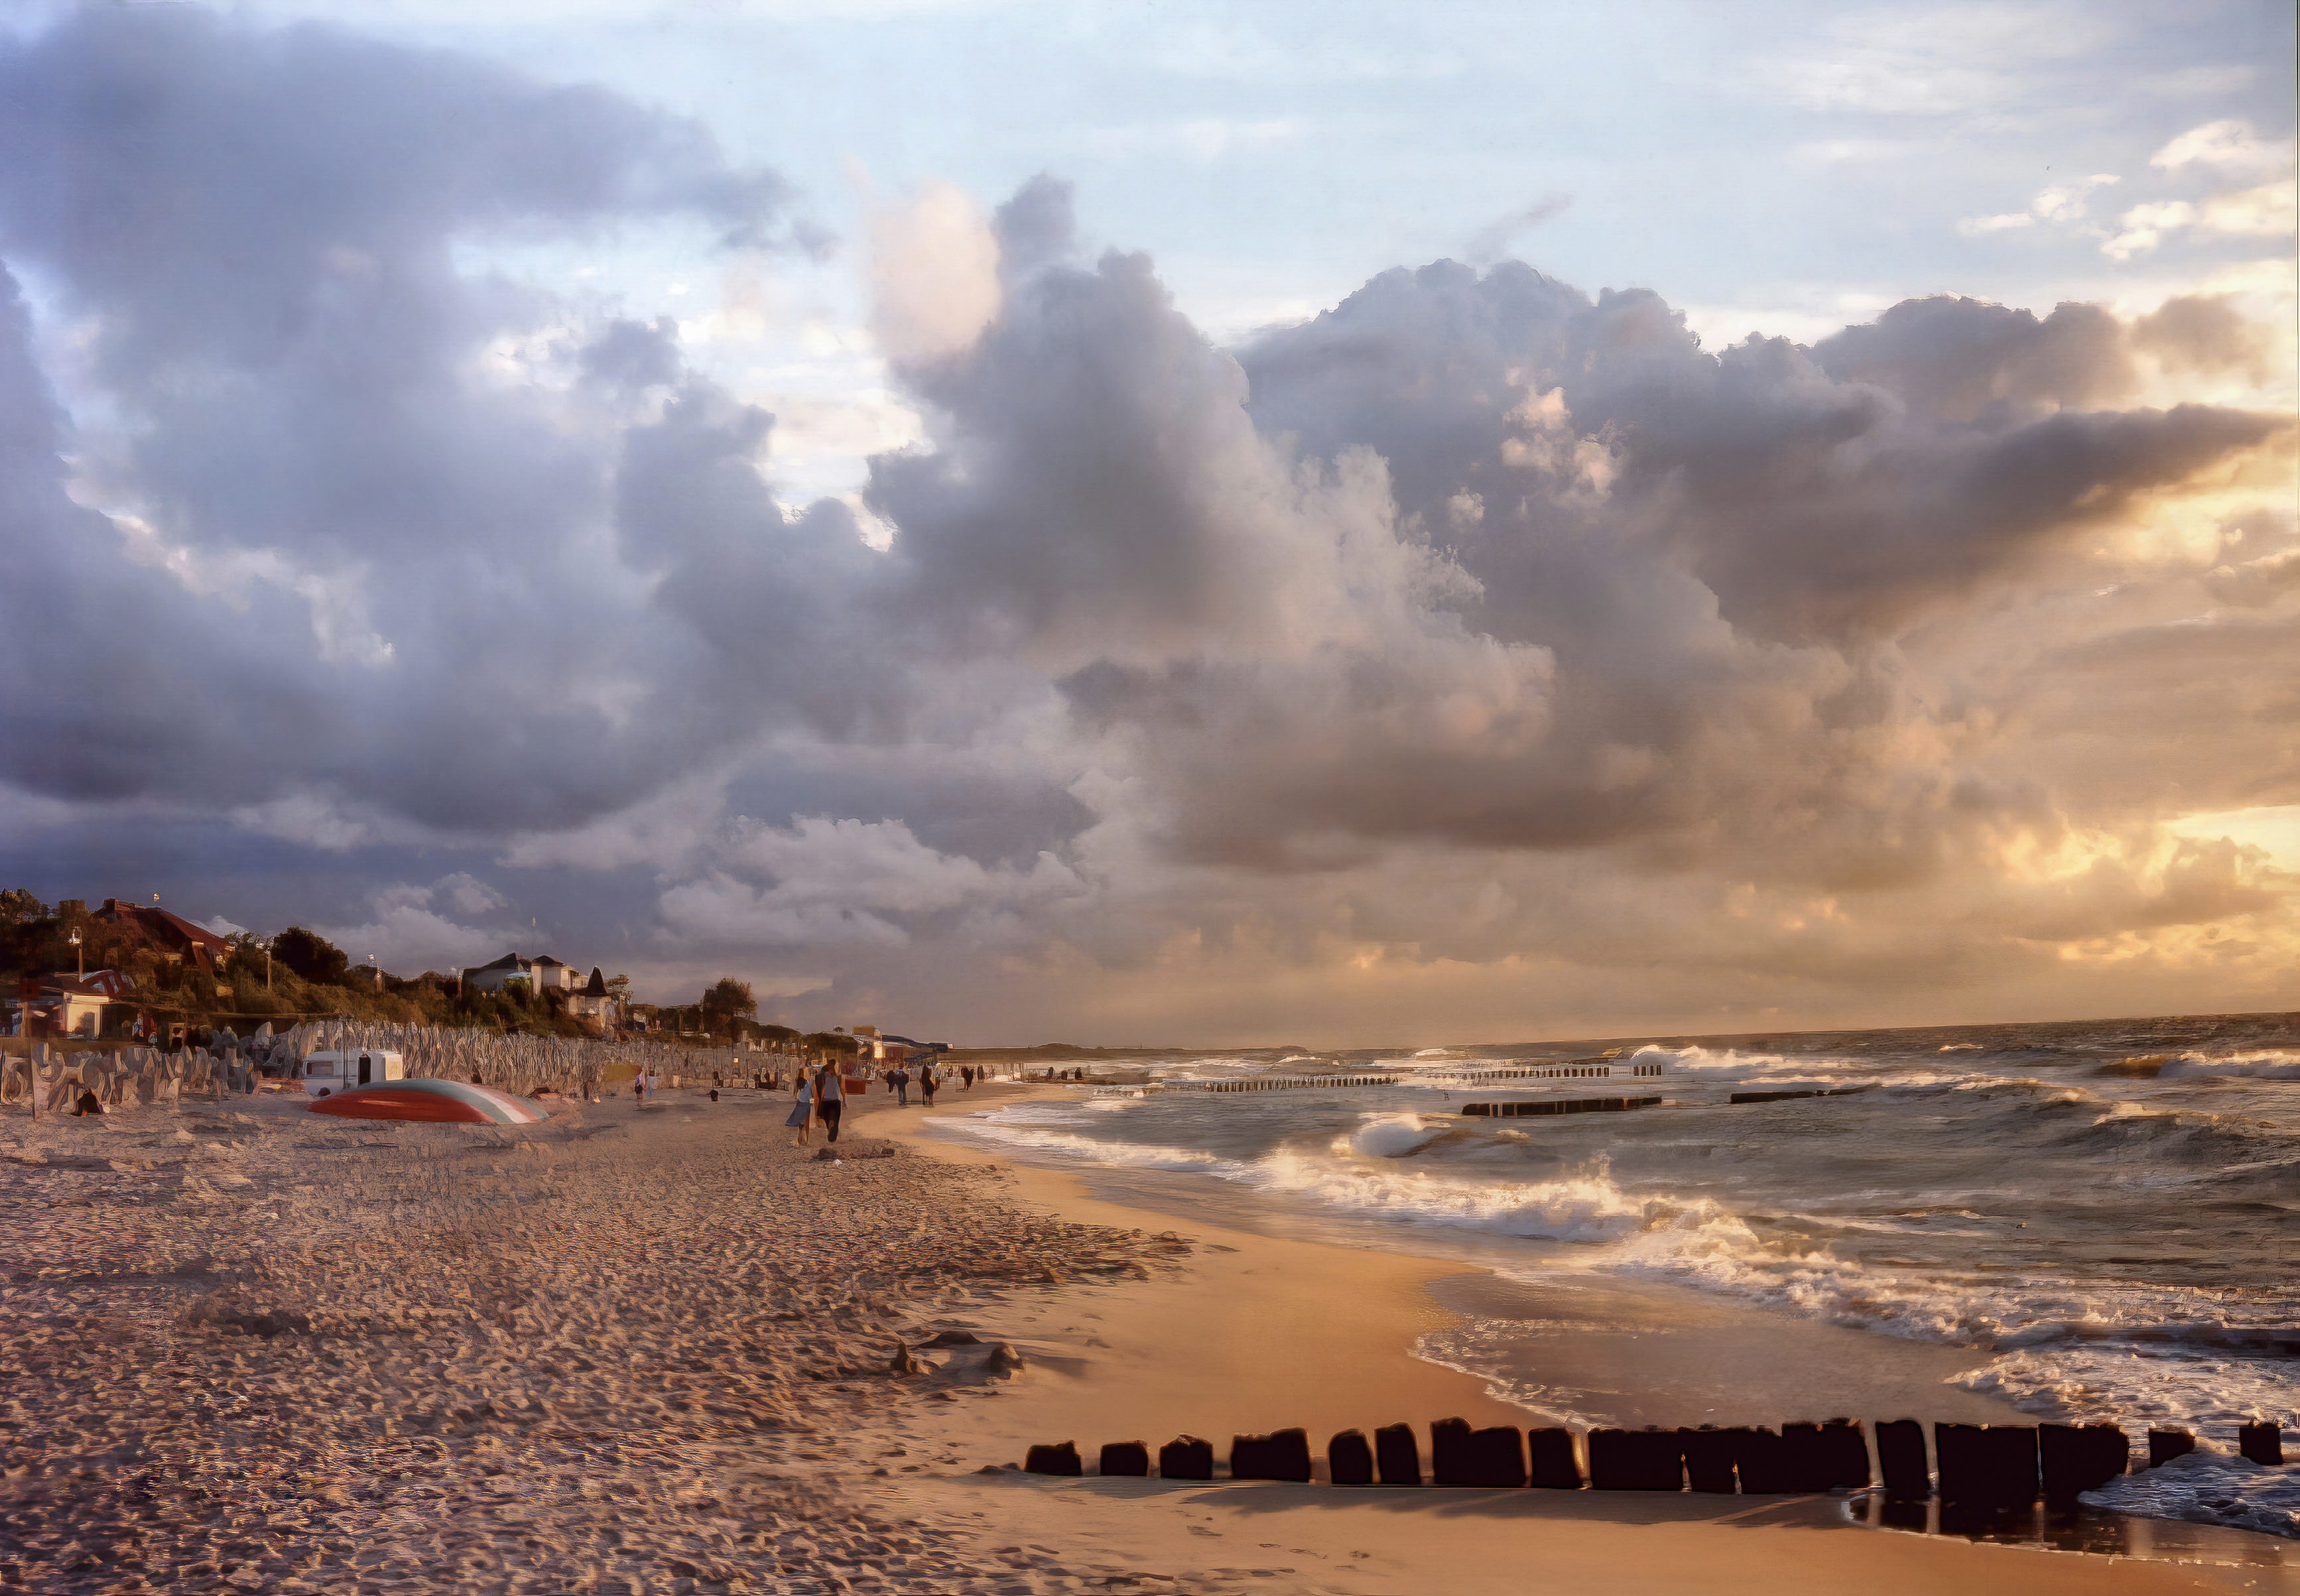
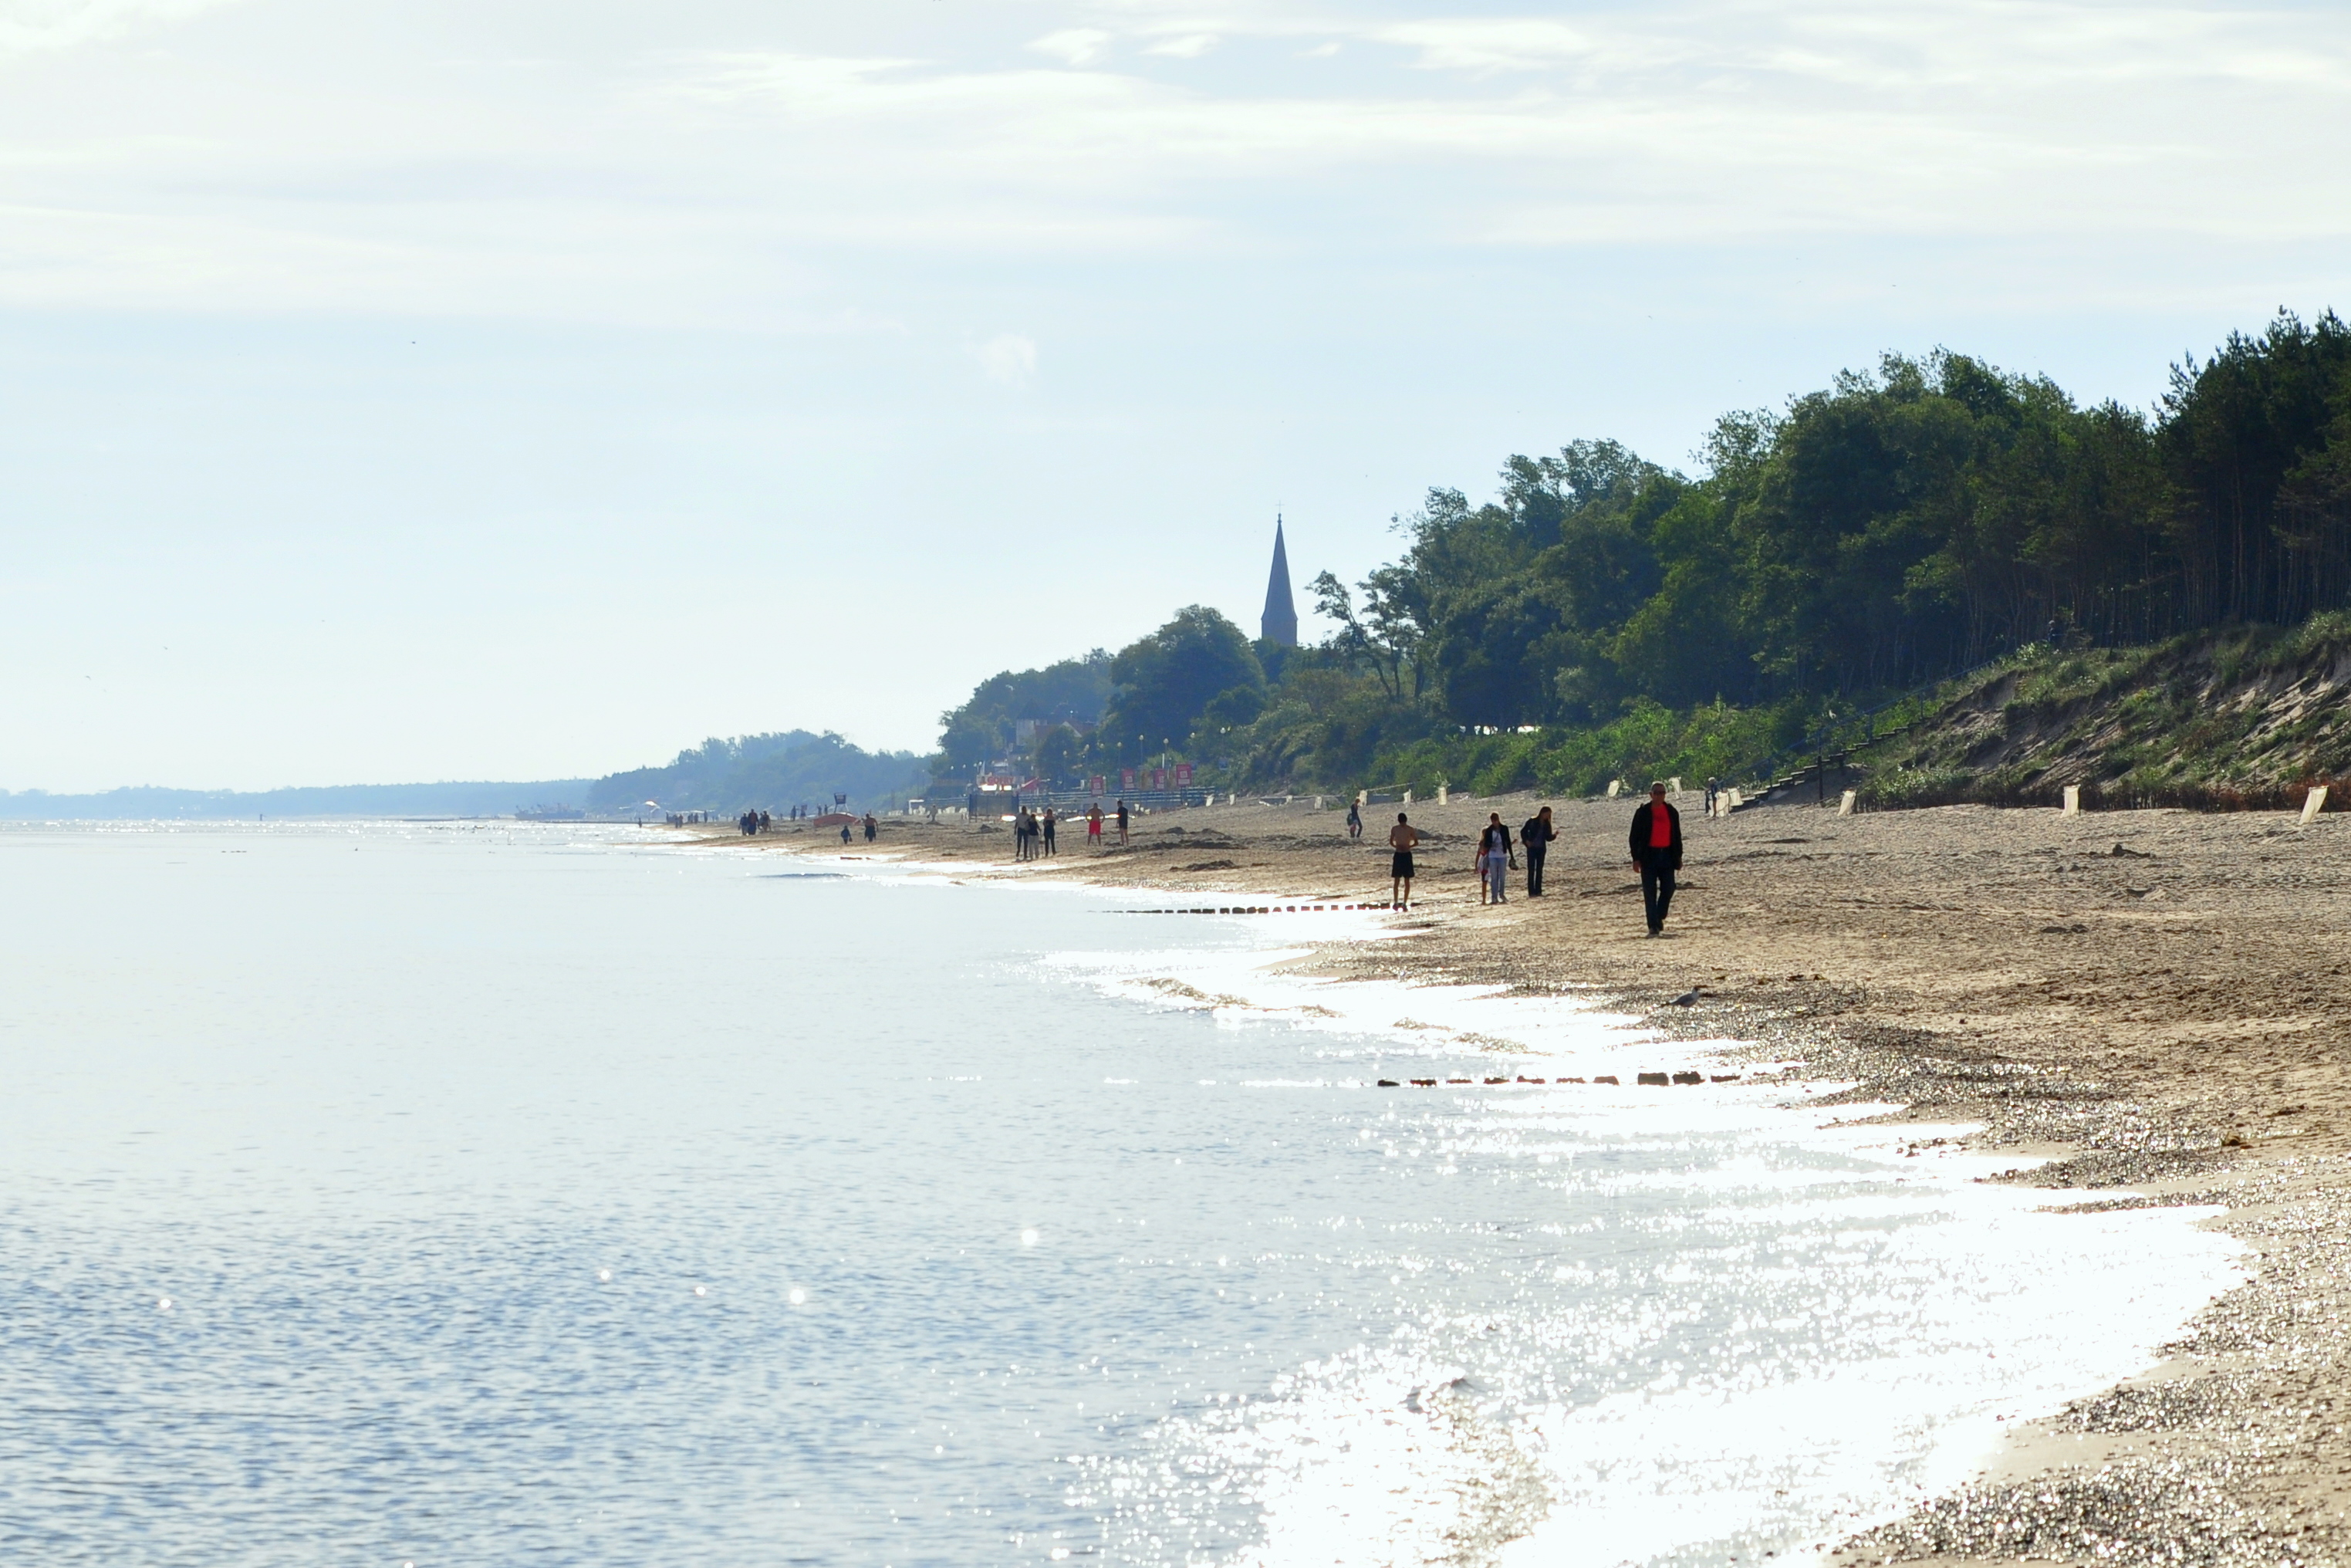
Koszalin
Koszalin ([kɔˈʂalʲin]; Kashubian: Kòszalëno; German: Köslin) is a city in Western Pomerania in north-western Poland. It is located 12 kilometres (7 miles) south of the Baltic Sea coast, and intersected by the river Dzierżęcinka. Koszalin is also a co..
Koszalin Wikipedia Page

About Our Data
The data on this page is estimated using a number of publicly available tools and resources. It is provided without warranty, and could contain inaccuracies. Use at your own risk.