Industries
Business Distribution by Industry in Ochota
Ochota Facts
| Area | 6.6 km² |
| Population | 52,945 |
| Male Population | 25,204 (47.6%) |
| Female Population | 27,741 (52.4%) |
| Population change (1975 to 2020) | -26.1% |
| Population change (2000 to 2020) | -13.9% |
| Median Age | 36.5 years (Male: 35.4, Female: 37.5) |
| Neighborhoods | Stara Ochota, Ochota, Czyste, Wyględów, Ulrychów |
| Local Time | |
| Timezone | Central European Summer Time |
| Lat & Lng | 52.22096, 20.98526 |
| Postal Codes | 00-912, 00-922, 01-216, 01-217, 01-218, More |
Map of Ochota
Interactive Map
Ochota Population
Years 1975 to 2020
| Data | 1975 | 1990 | 2000 | 2015 | 2020 |
|---|---|---|---|---|---|
| Population | 71,682 | 67,876 | 61,499 | 51,514 | 52,945 |
| Population Density | 10,923 / km² | 10,343 / km² | 9,371.3 / km² | 7,849.8 / km² | 8,067.8 / km² |
Ochota Population change from 2000 to 2015
Decrease of 16.2% from year 2000 to 2015
| Location | Change since 1975 | Change since 1990 | Change since 2000 |
|---|---|---|---|
| Ochota | -28.1% | -24.1% | -16.2% |
| Poland | +13% | +1.1% | +0.3% |
Ochota Median Age
Median Age: 36.5 years
| Location | Median Age | Median Age (Female) | Median Age (Male) |
|---|---|---|---|
| Ochota | 36.5 yrs | 37.5 yrs | 35.4 yrs |
| Poland | 34.9 yrs | 35.6 yrs | 34.3 yrs |
Ochota Population Density
Population Density: 8,068 / km²
| Location | Population | Area | Density |
|---|---|---|---|
| Ochota | 52,945 | 6.6 km² | 8,068 / km² |
| Poland | 38.5 million | 312,592.3 km² | 123 / km² |
Ochota Historical and Projected Population
Estimated Population from 1710 to 2100
- JRC (European Commission's Joint Research Centre) work on the GHS built-up grid
- CIESIN (Center for International Earth Science Information Network)
- [Link] Klein Goldewijk, K., Beusen, A., Doelman, J., and Stehfest, E.: Anthropogenic land use estimates for the Holocene – HYDE 3.2, Earth Syst. Sci. Data, 9, 927–953, https://doi.org/10.5194/essd-9-927-2017, 2017.
Neighborhoods in Ochota
Percentage of businesses by neighborhood in Ochota
Price Distribution
Business distribution by price for Ochota
Human Development Index (HDI)
Statistic composite index of life expectancy, education, and per capita income.
Ochota CO2 Emissions
Carbon Dioxide (CO2) Emissions Per Capita in Tonnes Per Year
| Location | CO2 Emissions | CO2 Emissions Per Capita | CO2 Emissions Intensity |
|---|---|---|---|
| Ochota | 483,411 tn | 9.13 tn | 73,662.7 tons/km² |
| Poland | 230,825,573 tn | 5.99 tn | 738.4 tons/km² |
| 2013 CO2 emissions (tonnes/year) | 483,411 tn |
| 2013 CO2 emissions (tonnes/year) per capita | 9.13 tn |
| 2013 CO2 emissions intensity (tonnes/km²/year) | 73,662.7 tons/km² |
Recent Nearby Earthquakes
Magnitude 3.0 and greater
| Date▼ | Time↕ | Magnitude↕ | Distance↕ | Depth↕ | Location↕ | Link |
|---|---|---|---|---|---|---|
| 5/10/90 | 2:31 AM | 3.1 | 85.6 km | 10,000 m | Poland | usgs.gov |
| 11/24/88 | 8:26 PM | 3 | 34.1 km | 10,000 m | Poland | usgs.gov |
| 11/6/88 | 11:11 AM | 3.7 | 56.3 km | 10,000 m | Poland | usgs.gov |
| 2/22/88 | 10:42 PM | 3 | 65.9 km | 10,000 m | Poland | usgs.gov |
| 1/21/85 | 6:44 PM | 3.4 | 47.4 km | 10,000 m | Poland | usgs.gov |
| 1/7/85 | 2:22 AM | 3.1 | 63.1 km | 10,000 m | Poland | usgs.gov |
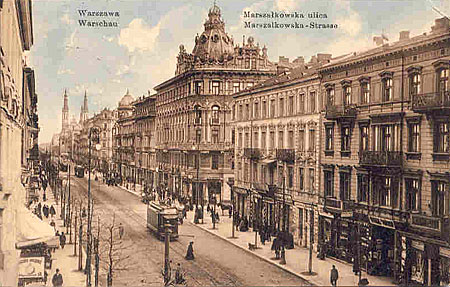
Ochota
Ochota (Polish pronunciation: [ɔˈxɔta]) is a district of Warsaw, Poland, located in the central part of the Polish capital city's urban agglomeration. biggest housing estates of Ochota are:
Ochota Wikipedia Page


About Our Data
The data on this page is estimated using a number of publicly available tools and resources. It is provided without warranty, and could contain inaccuracies. Use at your own risk.