Categories in Zator
Industries
Business Distribution by Industry in Zator
| Industry Description | Number of Establishments |
|---|---|
| Other accommodation | 69 |
| Restaurants | 41 |
| Grocery stores and supermarkets | 32 |
| Shopping | 29 |
| Amusement parks | 26 |
| Car repair | 22 |
| Freight/commercial transport | 22 |
| Sports and recreation | 21 |
| Buses and trains | 21 |
| Clothing stores | 20 |
| All food and beverage | 20 |
| Financial services | 19 |
| Health and medical | 19 |
| Construction of buildings | 19 |
| Hardware store | 18 |
| Construction | 18 |
| Hotels and motels | 17 |
| Beauty salons | 14 |
Zator Facts
| Area | 61.1 km² |
| Population | 9,045 |
| Male Population | 4,625 (51.1%) |
| Female Population | 4,420 (48.9%) |
| Population change (1975 to 2020) | +25.1% |
| Population change (2000 to 2020) | +1.5% |
| Median Age | 34.2 years (Male: 33.2, Female: 35.2) |
| Area Codes | 33 |
| Neighborhoods | Zator, Mirów |
| Local Time | |
| Timezone | Central European Summer Time |
| Lat & Lng | 49.99604, 19.43799 |
| Postal Codes | 32-640 |
Map of Zator
Interactive Map
Zator Population
Years 1975 to 2020
| Data | 1975 | 1990 | 2000 | 2015 | 2020 |
|---|---|---|---|---|---|
| Population | 7,230 | 8,593 | 8,907 | 9,229 | 9,045 |
| Population Density | 118.4 / km² | 140.7 / km² | 145.9 / km² | 151.1 / km² | 148.1 / km² |
Zator Population change from 2000 to 2015
Increase of 3.6% from year 2000 to 2015
| Location | Change since 1975 | Change since 1990 | Change since 2000 |
|---|---|---|---|
| Zator | +27.6% | +7.4% | +3.6% |
| Lesser Poland Voivodeship | +24.2% | +6.6% | +3.2% |
| Poland | +13% | +1.1% | +0.3% |
Zator Median Age
Median Age: 34.2 years
| Location | Median Age | Median Age (Female) | Median Age (Male) |
|---|---|---|---|
| Zator | 34.2 yrs | 35.2 yrs | 33.2 yrs |
| Lesser Poland Voivodeship | 33.8 yrs | 34.3 yrs | 33.2 yrs |
| Poland | 34.9 yrs | 35.6 yrs | 34.3 yrs |
Zator Population Density
Population Density: 148 / km²
| Location | Population | Area | Density |
|---|---|---|---|
| Zator | 9,045 | 61.1 km² | 148 / km² |
| Lesser Poland Voivodeship | 3.4 million | 15,196.3 km² | 222 / km² |
| Poland | 38.5 million | 312,592.3 km² | 123 / km² |
Zator Historical and Projected Population
Estimated Population from 800 to 2100
- JRC (European Commission's Joint Research Centre) work on the GHS built-up grid
- CIESIN (Center for International Earth Science Information Network)
- [Link] Klein Goldewijk, K., Beusen, A., Doelman, J., and Stehfest, E.: Anthropogenic land use estimates for the Holocene – HYDE 3.2, Earth Syst. Sci. Data, 9, 927–953, https://doi.org/10.5194/essd-9-927-2017, 2017.
Area Codes
Percentage Area Codes used by businesses in Zator
Price Distribution
Business distribution by price for Zator
Human Development Index (HDI)
Statistic composite index of life expectancy, education, and per capita income.
Zator CO2 Emissions
Carbon Dioxide (CO2) Emissions Per Capita in Tonnes Per Year
| Location | CO2 Emissions | CO2 Emissions Per Capita | CO2 Emissions Intensity |
|---|---|---|---|
| Zator | 53,487 tn | 5.91 tn | 875.9 tons/km² |
| Lesser Poland Voivodeship | 19,975,110 tn | 5.93 tn | 1,314.5 tons/km² |
| Poland | 230,825,573 tn | 5.99 tn | 738.4 tons/km² |
| 2013 CO2 emissions (tonnes/year) | 53,487 tn |
| 2013 CO2 emissions (tonnes/year) per capita | 5.91 tn |
| 2013 CO2 emissions intensity (tonnes/km²/year) | 875.9 tons/km² |
Natural Hazards Risk
Relative risk out of 10
| Hazard | Risk Level |
|---|---|
| Flood | High (9) |
| Earthquake | Low (2) |
* Risk, particularly concerning flood or landslide, may not be for the entire area.
- Dilley, M., R.S. Chen, U. Deichmann, A.L. Lerner-Lam, M. Arnold, J. Agwe, P. Buys, O. Kjekstad, B. Lyon, and G. Yetman. 2005. Natural Disaster Hotspots: A Global Risk Analysis. Washington, D.C.: World Bank. https://doi.org/10.1596/0-8213-5930-4.
- Center for Hazards and Risk Research - CHRR - Columbia University, Center for International Earth Science Information Network - CIESIN - Columbia University. 2005. Global Flood Hazard Frequency and Distribution. Palisades, NY: NASA Socioeconomic Data and Applications Center (SEDAC). https://doi.org/10.7927/H4668B3D.
- Center for Hazards and Risk Research - CHRR - Columbia University, Center for International Earth Science Information Network - CIESIN - Columbia University. 2005. Global Earthquake Hazard Distribution - Peak Ground Acceleration. Palisades, NY: NASA Socioeconomic Data and Applications Center (SEDAC). https://doi.org/10.7927/H4BZ63ZS.
Recent Nearby Earthquakes
Magnitude 3.0 and greater
| Date▼ | Time↕ | Magnitude↕ | Distance↕ | Depth↕ | Location↕ | Link |
|---|---|---|---|---|---|---|
| 11/17/15 | 11:28 PM | 4.1 | 20.8 km | 6,060 m | 3km N of Chelmek, Poland | usgs.gov |
| 4/17/15 | 10:16 PM | 4.3 | 47.9 km | 5,000 m | 2km ESE of Ruda Slaska, Poland | usgs.gov |
| 11/19/08 | 12:45 AM | 3.2 | 35.5 km | 1,000 m | Poland | usgs.gov |
| 2/23/08 | 6:32 PM | 3.1 | 46.8 km | 5,000 m | Poland | usgs.gov |
| 2/14/08 | 3:49 PM | 3.1 | 38 km | 5,000 m | Poland | usgs.gov |
| 1/16/08 | 10:21 AM | 3 | 23.3 km | 5,000 m | Poland | usgs.gov |
| 5/4/07 | 3:42 PM | 3 | 31 km | 5,000 m | Poland | usgs.gov |
| 12/16/06 | 2:30 AM | 3.2 | 33.1 km | 5,000 m | Poland | usgs.gov |
| 12/19/05 | 2:32 AM | 3.2 | 38.9 km | 1,000 m | Poland | usgs.gov |
| 6/28/05 | 12:35 PM | 3.3 | 21.2 km | 5,000 m | Poland | usgs.gov |
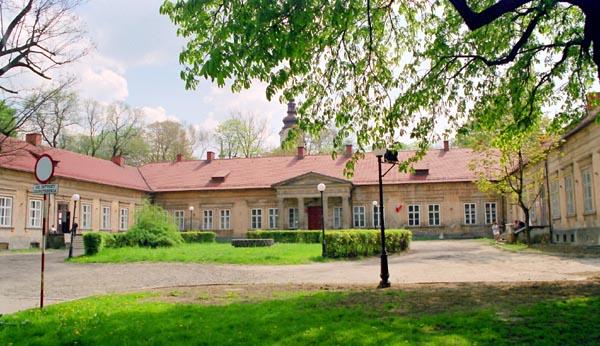
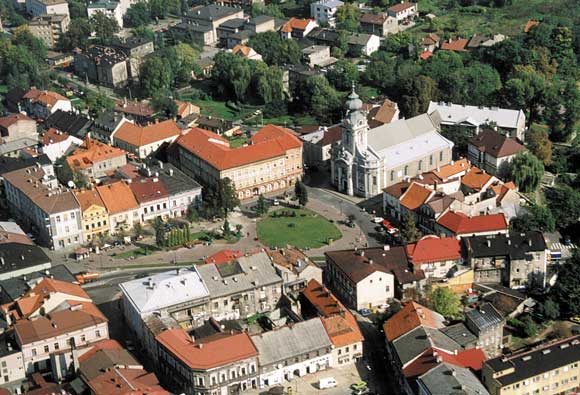
Zator
Zator [ˈzatɔr] (German: Neuenstadt an der Schaue, Wymysorys: Naojśtaod) is an old town on the Skawa river within Oświęcim County, Lesser Poland Voivodeship (since 1999) in southern Poland. From 1975 to 1998 it belonged to the Bielsko-Biała Voivodeshi..
Zator Wikipedia Page

About Our Data
The data on this page is estimated using a number of publicly available tools and resources. It is provided without warranty, and could contain inaccuracies. Use at your own risk.