Industries
Business Distribution by Industry in Vilamoura
| Industry Description | Number of Establishments |
|---|---|
| Other accommodation | 29 |
| Restaurants | 23 |
| Hotels and motels | 11 |
| Travel agencies | 5 |
| Bars, pubs and taverns | 5 |
Vilamoura Facts
| Area | 8.4 km² |
| Population | 1,869 |
| Male Population | 917 (49.0%) |
| Female Population | 952 (51.0%) |
| Population change (1975 to 2020) | +136.0% |
| Population change (2000 to 2020) | +33.0% |
| Median Age | 39.5 years (Male: 38.9, Female: 40.1) |
| Neighborhoods | Vilamoura, Quarteira |
| Local Time | |
| Timezone | Western European Summer Time |
| Lat & Lng | 37.08100, -8.11083 |
| Postal Codes | 8125 |
Map of Vilamoura
Interactive Map
Vilamoura Population
Years 1975 to 2020
| Data | 1975 | 1990 | 2000 | 2015 | 2020 |
|---|---|---|---|---|---|
| Population | 792 | 1,131 | 1,405 | 1,821 | 1,869 |
| Population Density | 94.6 / km² | 135 / km² | 167.8 / km² | 217.4 / km² | 223.2 / km² |
Vilamoura Population change from 2000 to 2015
Increase of 29.6% from year 2000 to 2015
| Location | Change since 1975 | Change since 1990 | Change since 2000 |
|---|---|---|---|
| Vilamoura | +129.9% | +61% | +29.6% |
| Faro District | +78.1% | +39.7% | +19.8% |
| Portugal | +12.6% | +4.6% | +0.7% |
Vilamoura Median Age
Median Age: 39.5 years
| Location | Median Age | Median Age (Female) | Median Age (Male) |
|---|---|---|---|
| Vilamoura | 39.5 yrs | 40.1 yrs | 38.9 yrs |
| Faro District | 42.2 yrs | 43.1 yrs | 41.3 yrs |
| Portugal | 42 yrs | 43.5 yrs | 40.4 yrs |
Vilamoura Population Density
Population Density: 223 / km²
| Location | Population | Area | Density |
|---|---|---|---|
| Vilamoura | 1,869 | 8.4 km² | 223 / km² |
| Faro District | 462,681 | 5,011.3 km² | 92.3 / km² |
| Portugal | 10.3 million | 92,264.9 km² | 112 / km² |
Vilamoura Historical and Projected Population
Estimated Population from 1100 to 2100
- JRC (European Commission's Joint Research Centre) work on the GHS built-up grid
- CIESIN (Center for International Earth Science Information Network)
- [Link] Klein Goldewijk, K., Beusen, A., Doelman, J., and Stehfest, E.: Anthropogenic land use estimates for the Holocene – HYDE 3.2, Earth Syst. Sci. Data, 9, 927–953, https://doi.org/10.5194/essd-9-927-2017, 2017.
Area Codes
Percentage Area Codes used by businesses in Vilamoura
Price Distribution
Business distribution by price for Vilamoura
Human Development Index (HDI)
Statistic composite index of life expectancy, education, and per capita income.
Vilamoura CO2 Emissions
Carbon Dioxide (CO2) Emissions Per Capita in Tonnes Per Year
| Location | CO2 Emissions | CO2 Emissions Per Capita | CO2 Emissions Intensity |
|---|---|---|---|
| Vilamoura | 12,437 tn | 6.65 tn | 1,485 tons/km² |
| Faro District | 3,030,349 tn | 6.55 tn | 604.7 tons/km² |
| Portugal | 63,833,570 tn | 6.2 tn | 691.9 tons/km² |
| 2013 CO2 emissions (tonnes/year) | 12,437 tn |
| 2013 CO2 emissions (tonnes/year) per capita | 6.65 tn |
| 2013 CO2 emissions intensity (tonnes/km²/year) | 1,485 tons/km² |
Natural Hazards Risk
Relative risk out of 10
| Hazard | Risk Level |
|---|---|
| Drought | Medium (7) |
| Earthquake | Medium (4) |
* Risk, particularly concerning flood or landslide, may not be for the entire area.
- Dilley, M., R.S. Chen, U. Deichmann, A.L. Lerner-Lam, M. Arnold, J. Agwe, P. Buys, O. Kjekstad, B. Lyon, and G. Yetman. 2005. Natural Disaster Hotspots: A Global Risk Analysis. Washington, D.C.: World Bank. https://doi.org/10.1596/0-8213-5930-4.
- Center for Hazards and Risk Research - CHRR - Columbia University, Center for International Earth Science Information Network - CIESIN - Columbia University, and International Research Institute for Climate and Society - IRI - Columbia University. 2005. Global Drought Hazard Frequency and Distribution. Palisades, NY: NASA Socioeconomic Data and Applications Center (SEDAC). https://doi.org/10.7927/H4VX0DFT.
- Center for Hazards and Risk Research - CHRR - Columbia University, Center for International Earth Science Information Network - CIESIN - Columbia University. 2005. Global Earthquake Hazard Distribution - Peak Ground Acceleration. Palisades, NY: NASA Socioeconomic Data and Applications Center (SEDAC). https://doi.org/10.7927/H4BZ63ZS.
Recent Nearby Earthquakes
Magnitude 3.0 and greater
| Date▼ | Time↕ | Magnitude↕ | Distance↕ | Depth↕ | Location↕ | Link |
|---|---|---|---|---|---|---|
| 9/11/17 | 6:09 PM | 3.6 | 44.9 km | 27,050 m | 5km ESE of Lagos, Portugal | usgs.gov |
| 7/22/15 | 4:35 AM | 3.4 | 44.3 km | 15,000 m | 7km ENE of Monchique, Portugal | usgs.gov |
| 3/26/11 | 7:36 AM | 3.8 | 45.3 km | 8,100 m | Portugal | usgs.gov |
| 9/8/08 | 1:01 PM | 3.1 | 56.6 km | 47,400 m | Strait of Gibraltar | usgs.gov |
| 8/16/08 | 11:42 PM | 3.1 | 73.1 km | 38,300 m | Strait of Gibraltar | usgs.gov |
| 12/10/07 | 5:25 PM | 3.1 | 40 km | 17,400 m | west of Gibraltar | usgs.gov |
| 11/20/07 | 4:46 AM | 3.1 | 69.4 km | 58,000 m | Strait of Gibraltar | usgs.gov |
| 9/1/07 | 12:41 PM | 3 | 70.2 km | 51,500 m | Strait of Gibraltar | usgs.gov |
| 8/18/07 | 10:09 PM | 3.9 | 65.2 km | 50,100 m | Strait of Gibraltar | usgs.gov |
| 4/15/07 | 8:49 PM | 3.1 | 65.3 km | 0 m | Strait of Gibraltar | usgs.gov |
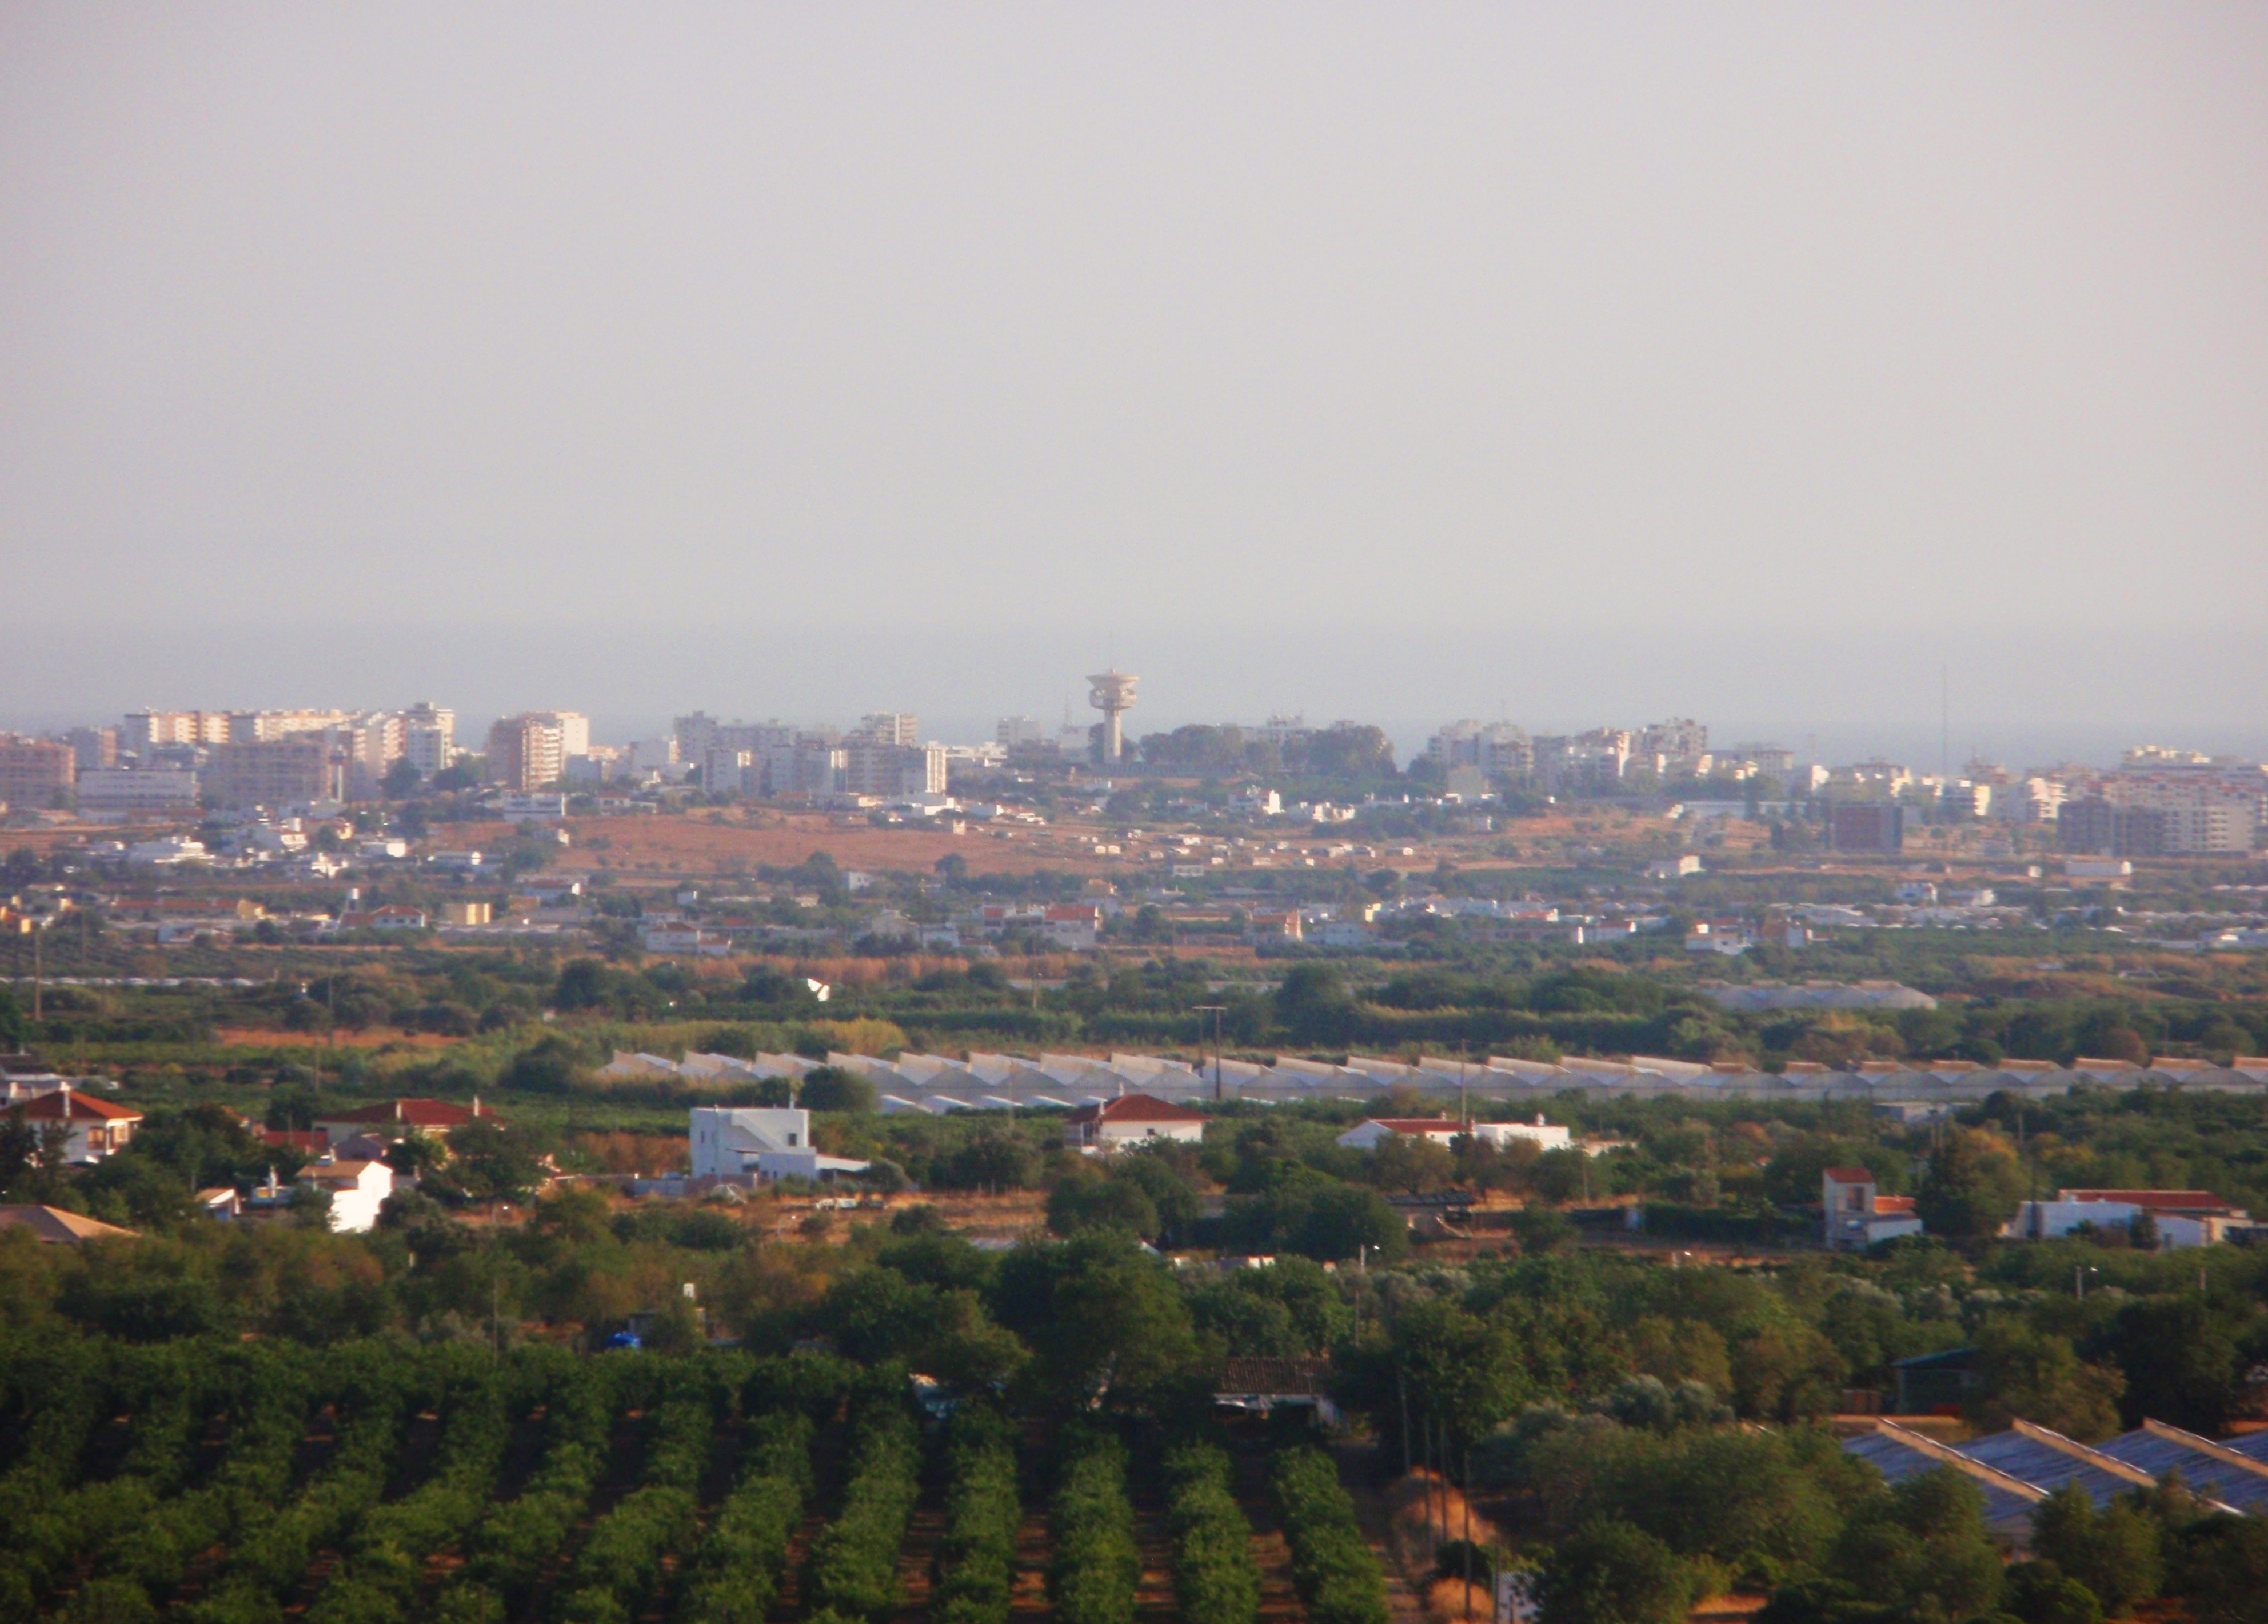
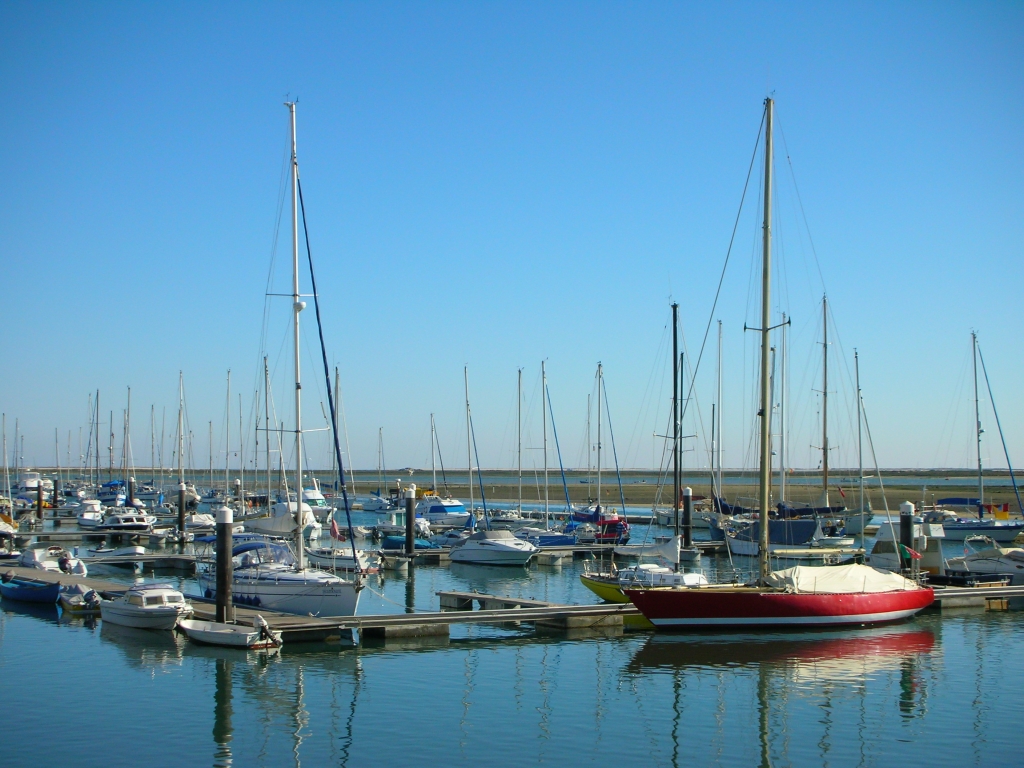
Vilamoura
Vilamoura is an unincorporated area on the southern coast of Portugal, comprising one of the largest single tourist complexes in Europe and with about 2,000 hectares of land. The nearest airport is in Faro. It comprises one of the three corners of wh..
Vilamoura Wikipedia Page

About Our Data
The data on this page is estimated using a number of publicly available tools and resources. It is provided without warranty, and could contain inaccuracies. Use at your own risk.