Chețani Facts
| Area | 1.1 km² |
| Population | 716 |
| Population change (1975 to 2020) | -34.8% |
| Population change (2000 to 2020) | -30.6% |
| Local Time | |
| Timezone | Eastern European Summer Time |
| Lat & Lng | 46.46667, 24.03333 |
| Postal Codes | 547150 |
Map of Chețani
Interactive Map
Chețani Population
Years 1975 to 2020
| Data | 1975 | 1990 | 2000 | 2015 | 2020 |
|---|---|---|---|---|---|
| Population | 1,098 | 1,212 | 1,031 | 738 | 716 |
| Population Density | 976 / km² | 1,077.3 / km² | 916.4 / km² | 656 / km² | 636.4 / km² |
Chețani Population change from 2000 to 2015
Decrease of 28.4% from year 2000 to 2015
| Location | Change since 1975 | Change since 1990 | Change since 2000 |
|---|---|---|---|
| Chețani | -32.8% | -39.1% | -28.4% |
| Mureș County | -7.5% | -18.8% | -16.2% |
| Romania | -9.9% | -16.9% | -11.8% |
Chețani Population Density
Population Density: 636 / km²
| Location | Population | Area | Density |
|---|---|---|---|
| Chețani | 716 | 1.125 km² | 636 / km² |
| Mureș County | 501,661 | 6,713.7 km² | 74.7 / km² |
| Romania | 19.5 million | 238,387.8 km² | 81.8 / km² |
Chețani Historical and Projected Population
Estimated Population from 0 to 2100
- JRC (European Commission's Joint Research Centre) work on the GHS built-up grid
- CIESIN (Center for International Earth Science Information Network)
- [Link] Klein Goldewijk, K., Beusen, A., Doelman, J., and Stehfest, E.: Anthropogenic land use estimates for the Holocene – HYDE 3.2, Earth Syst. Sci. Data, 9, 927–953, https://doi.org/10.5194/essd-9-927-2017, 2017.
Human Development Index (HDI)
Statistic composite index of life expectancy, education, and per capita income.
Chețani CO2 Emissions
Carbon Dioxide (CO2) Emissions Per Capita in Tonnes Per Year
| Location | CO2 Emissions | CO2 Emissions Per Capita | CO2 Emissions Intensity |
|---|---|---|---|
| Chețani | 3,371 tn | 4.71 tn | 2,996.8 tons/km² |
| Mureș County | 2,371,442 tn | 4.73 tn | 353.2 tons/km² |
| Romania | 86,961,323 tn | 4.46 tn | 364.8 tons/km² |
| 2013 CO2 emissions (tonnes/year) | 3,371 tn |
| 2013 CO2 emissions (tonnes/year) per capita | 4.71 tn |
| 2013 CO2 emissions intensity (tonnes/km²/year) | 2,996.8 tons/km² |
Natural Hazards Risk
Relative risk out of 10
| Hazard | Risk Level |
|---|---|
| Flood | High (9) |
| Earthquake | Medium (4) |
* Risk, particularly concerning flood or landslide, may not be for the entire area.
- Dilley, M., R.S. Chen, U. Deichmann, A.L. Lerner-Lam, M. Arnold, J. Agwe, P. Buys, O. Kjekstad, B. Lyon, and G. Yetman. 2005. Natural Disaster Hotspots: A Global Risk Analysis. Washington, D.C.: World Bank. https://doi.org/10.1596/0-8213-5930-4.
- Center for Hazards and Risk Research - CHRR - Columbia University, Center for International Earth Science Information Network - CIESIN - Columbia University. 2005. Global Flood Hazard Frequency and Distribution. Palisades, NY: NASA Socioeconomic Data and Applications Center (SEDAC). https://doi.org/10.7927/H4668B3D.
- Center for Hazards and Risk Research - CHRR - Columbia University, Center for International Earth Science Information Network - CIESIN - Columbia University. 2005. Global Earthquake Hazard Distribution - Peak Ground Acceleration. Palisades, NY: NASA Socioeconomic Data and Applications Center (SEDAC). https://doi.org/10.7927/H4BZ63ZS.
Recent Nearby Earthquakes
Magnitude 3.0 and greater
| Date▼ | Time↕ | Magnitude↕ | Distance↕ | Depth↕ | Location↕ | Link |
|---|---|---|---|---|---|---|
| 5/17/05 | 2:52 AM | 3.1 | 83.8 km | 33,800 m | Romania | usgs.gov |
| 8/10/94 | 11:06 AM | 3.1 | 94.4 km | 57,800 m | Romania | usgs.gov |
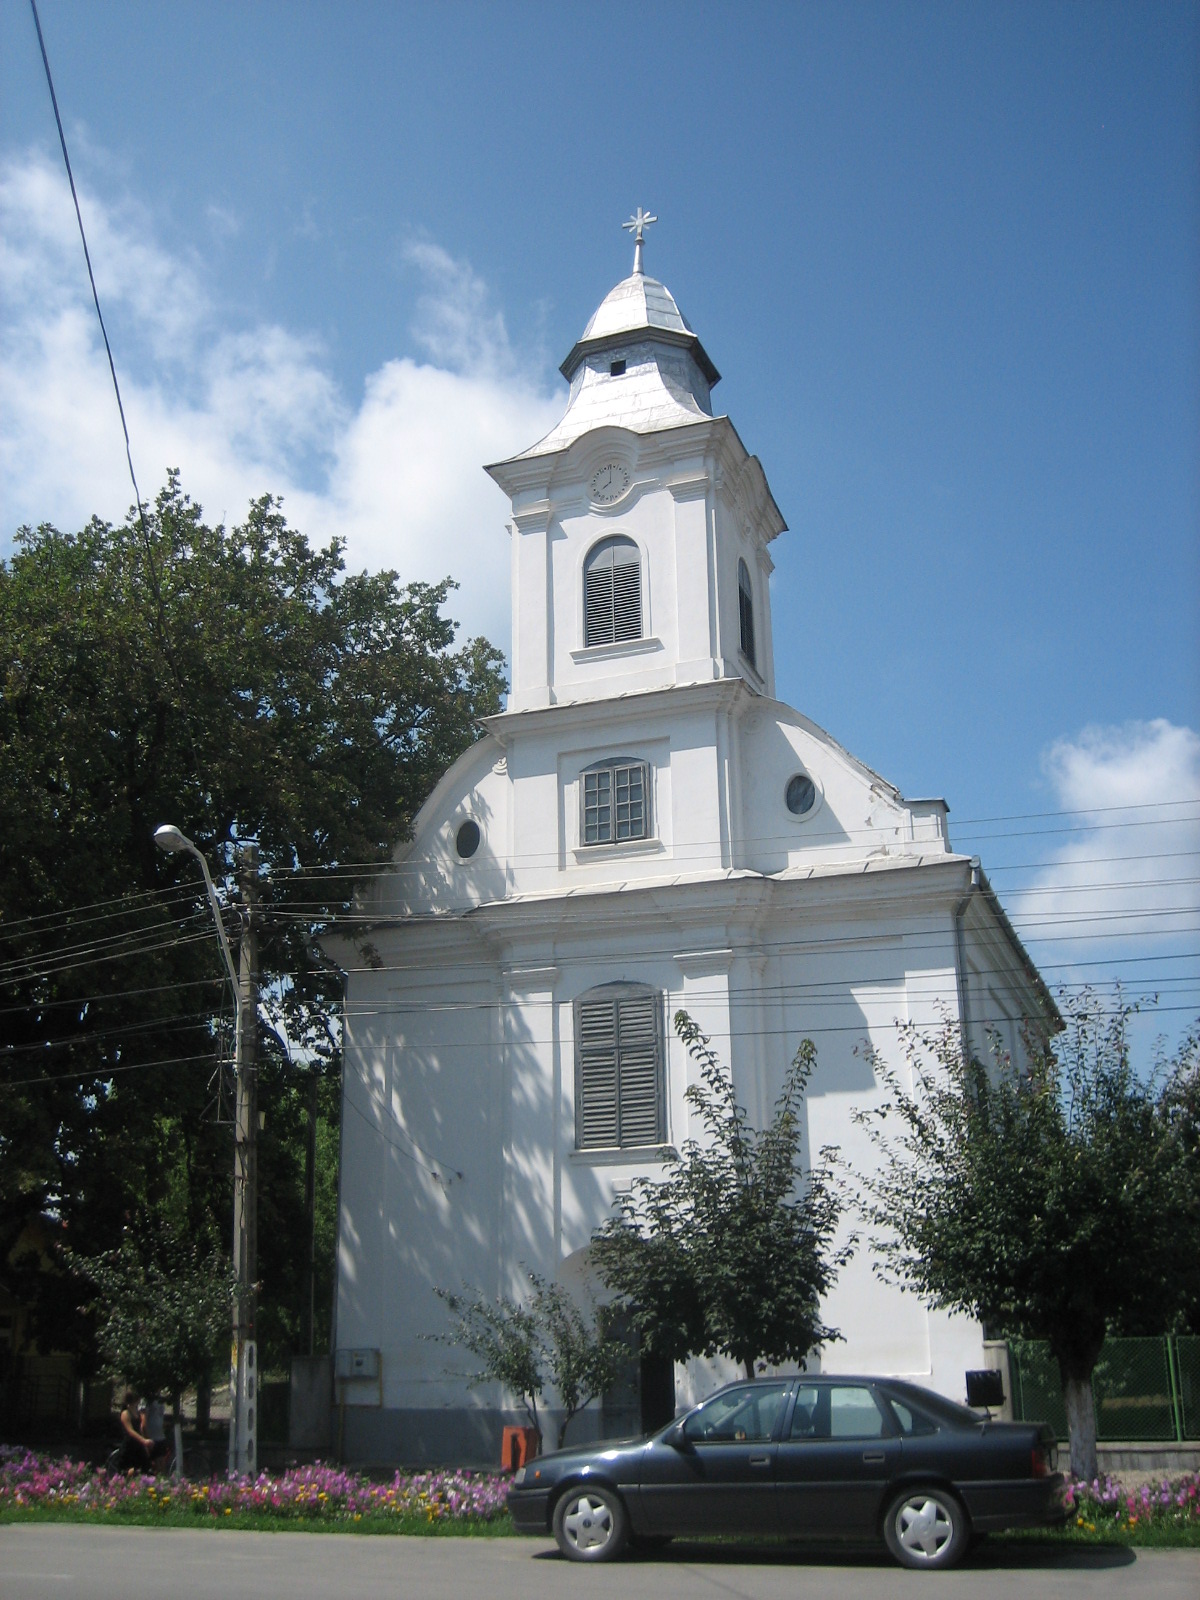
Chețani
Cheţani (Hungarian: Maroskece, Hungarian pronunciation: [mɒroʃkɛtsɛ]) is a commune in Mureş County, Transylvania, Romania. Its population was 2,857 in 2002. It is composed of seven villages: Cheţani, Coasta Grindului (Berekszéle), Cordoş (Kardos), Gi..
Chețani Wikipedia Page


About Our Data
The data on this page is estimated using a number of publicly available tools and resources. It is provided without warranty, and could contain inaccuracies. Use at your own risk.