Categories in Mangalia
Industries
Business Distribution by Industry in Mangalia
| Industry Description | Number of Establishments |
|---|---|
| Shopping | 126 |
| Other accommodation | 122 |
| Grocery stores and supermarkets | 117 |
| Restaurants | 104 |
| Real estate | 85 |
| Hotels and motels | 61 |
| Pharmacies and drug stores | 40 |
| Corporate management | 39 |
| Education | 33 |
| Clothing stores | 32 |
| Buses and trains | 32 |
| Car repair | 30 |
Mangalia Facts
| Area | 6.5 km² |
| Population | 21,268 |
| Male Population | 10,385 (48.8%) |
| Female Population | 10,883 (51.2%) |
| Population change (1975 to 2020) | -9.6% |
| Population change (2000 to 2020) | -17.2% |
| Median Age | 39.3 years (Male: 38.2, Female: 40.3) |
| Neighborhoods | Rezidențial Coloniști, Venus, Mangalia, Brătianu, Constanta |
| Local Time | |
| Timezone | Eastern European Summer Time |
| Lat & Lng | 43.80000, 28.58333 |
| Postal Codes | 905500, 905560 |
Map of Mangalia
Interactive Map
Mangalia Population
Years 1975 to 2020
| Data | 1975 | 1990 | 2000 | 2015 | 2020 |
|---|---|---|---|---|---|
| Population | 23,539 | 26,757 | 25,699 | 21,434 | 21,268 |
| Population Density | 3,621.4 / km² | 4,116.5 / km² | 3,953.7 / km² | 3,297.5 / km² | 3,272 / km² |
Mangalia Population change from 2000 to 2015
Decrease of 16.6% from year 2000 to 2015
| Location | Change since 1975 | Change since 1990 | Change since 2000 |
|---|---|---|---|
| Mangalia | -8.9% | -19.9% | -16.6% |
| Constanța County | -2.3% | -17% | -15.2% |
| Romania | -9.9% | -16.9% | -11.8% |
Mangalia Median Age
Median Age: 39.3 years
| Location | Median Age | Median Age (Female) | Median Age (Male) |
|---|---|---|---|
| Mangalia | 39.3 yrs | 40.3 yrs | 38.2 yrs |
| Constanța County | 39.6 yrs | 40.9 yrs | 38.1 yrs |
| Romania | 40.1 yrs | 41.6 yrs | 38.5 yrs |
Mangalia Population Density
Population Density: 3,272 / km²
| Location | Population | Area | Density |
|---|---|---|---|
| Mangalia | 21,268 | 6.5 km² | 3,272 / km² |
| Constanța County | 599,873 | 7,066.2 km² | 84.9 / km² |
| Romania | 19.5 million | 238,387.8 km² | 81.8 / km² |
Mangalia Historical and Projected Population
Estimated Population from 1300 to 2100
- JRC (European Commission's Joint Research Centre) work on the GHS built-up grid
- CIESIN (Center for International Earth Science Information Network)
- [Link] Klein Goldewijk, K., Beusen, A., Doelman, J., and Stehfest, E.: Anthropogenic land use estimates for the Holocene – HYDE 3.2, Earth Syst. Sci. Data, 9, 927–953, https://doi.org/10.5194/essd-9-927-2017, 2017.
Area Codes
Percentage Area Codes used by businesses in Mangalia
Price Distribution
Business distribution by price for Mangalia
Human Development Index (HDI)
Statistic composite index of life expectancy, education, and per capita income.
Mangalia CO2 Emissions
Carbon Dioxide (CO2) Emissions Per Capita in Tonnes Per Year
| Location | CO2 Emissions | CO2 Emissions Per Capita | CO2 Emissions Intensity |
|---|---|---|---|
| Mangalia | 97,679 tn | 4.59 tn | 15,027.6 tons/km² |
| Constanța County | 2,823,244 tn | 4.71 tn | 399.5 tons/km² |
| Romania | 86,961,323 tn | 4.46 tn | 364.8 tons/km² |
| 2013 CO2 emissions (tonnes/year) | 97,679 tn |
| 2013 CO2 emissions (tonnes/year) per capita | 4.59 tn |
| 2013 CO2 emissions intensity (tonnes/km²/year) | 15,027.6 tons/km² |
Natural Hazards Risk
Relative risk out of 10
| Hazard | Risk Level |
|---|---|
| Drought | Low (2) |
| Flood | Medium (7) |
| Earthquake | Medium (4) |
* Risk, particularly concerning flood or landslide, may not be for the entire area.
- Dilley, M., R.S. Chen, U. Deichmann, A.L. Lerner-Lam, M. Arnold, J. Agwe, P. Buys, O. Kjekstad, B. Lyon, and G. Yetman. 2005. Natural Disaster Hotspots: A Global Risk Analysis. Washington, D.C.: World Bank. https://doi.org/10.1596/0-8213-5930-4.
- Center for Hazards and Risk Research - CHRR - Columbia University, Center for International Earth Science Information Network - CIESIN - Columbia University, and International Research Institute for Climate and Society - IRI - Columbia University. 2005. Global Drought Hazard Frequency and Distribution. Palisades, NY: NASA Socioeconomic Data and Applications Center (SEDAC). https://doi.org/10.7927/H4VX0DFT.
- Center for Hazards and Risk Research - CHRR - Columbia University, Center for International Earth Science Information Network - CIESIN - Columbia University. 2005. Global Flood Hazard Frequency and Distribution. Palisades, NY: NASA Socioeconomic Data and Applications Center (SEDAC). https://doi.org/10.7927/H4668B3D.
- Center for Hazards and Risk Research - CHRR - Columbia University, Center for International Earth Science Information Network - CIESIN - Columbia University. 2005. Global Earthquake Hazard Distribution - Peak Ground Acceleration. Palisades, NY: NASA Socioeconomic Data and Applications Center (SEDAC). https://doi.org/10.7927/H4BZ63ZS.
Recent Nearby Earthquakes
Magnitude 3.0 and greater
| Date▼ | Time↕ | Magnitude↕ | Distance↕ | Depth↕ | Location↕ | Link |
|---|---|---|---|---|---|---|
| 7/15/15 | 8:30 AM | 3.8 | 48.2 km | 20,400 m | 18km S of Shabla, Bulgaria | usgs.gov |
| 12/3/12 | 6:58 PM | 4.5 | 39.7 km | 10,000 m | Black Sea | usgs.gov |
| 8/5/09 | 7:49 AM | 5 | 40.2 km | 10,000 m | Black Sea | usgs.gov |
| 8/24/06 | 9:00 PM | 3.8 | 47.9 km | 32,700 m | Black Sea | usgs.gov |
| 2/4/06 | 10:50 PM | 3 | 79.9 km | 12,300 m | Bulgaria | usgs.gov |
| 4/19/97 | 9:00 PM | 3.6 | 88.4 km | 10,000 m | Black Sea | usgs.gov |
| 6/30/56 | 1:50 AM | 5.5 | 47.5 km | 15,000 m | Black Sea | usgs.gov |
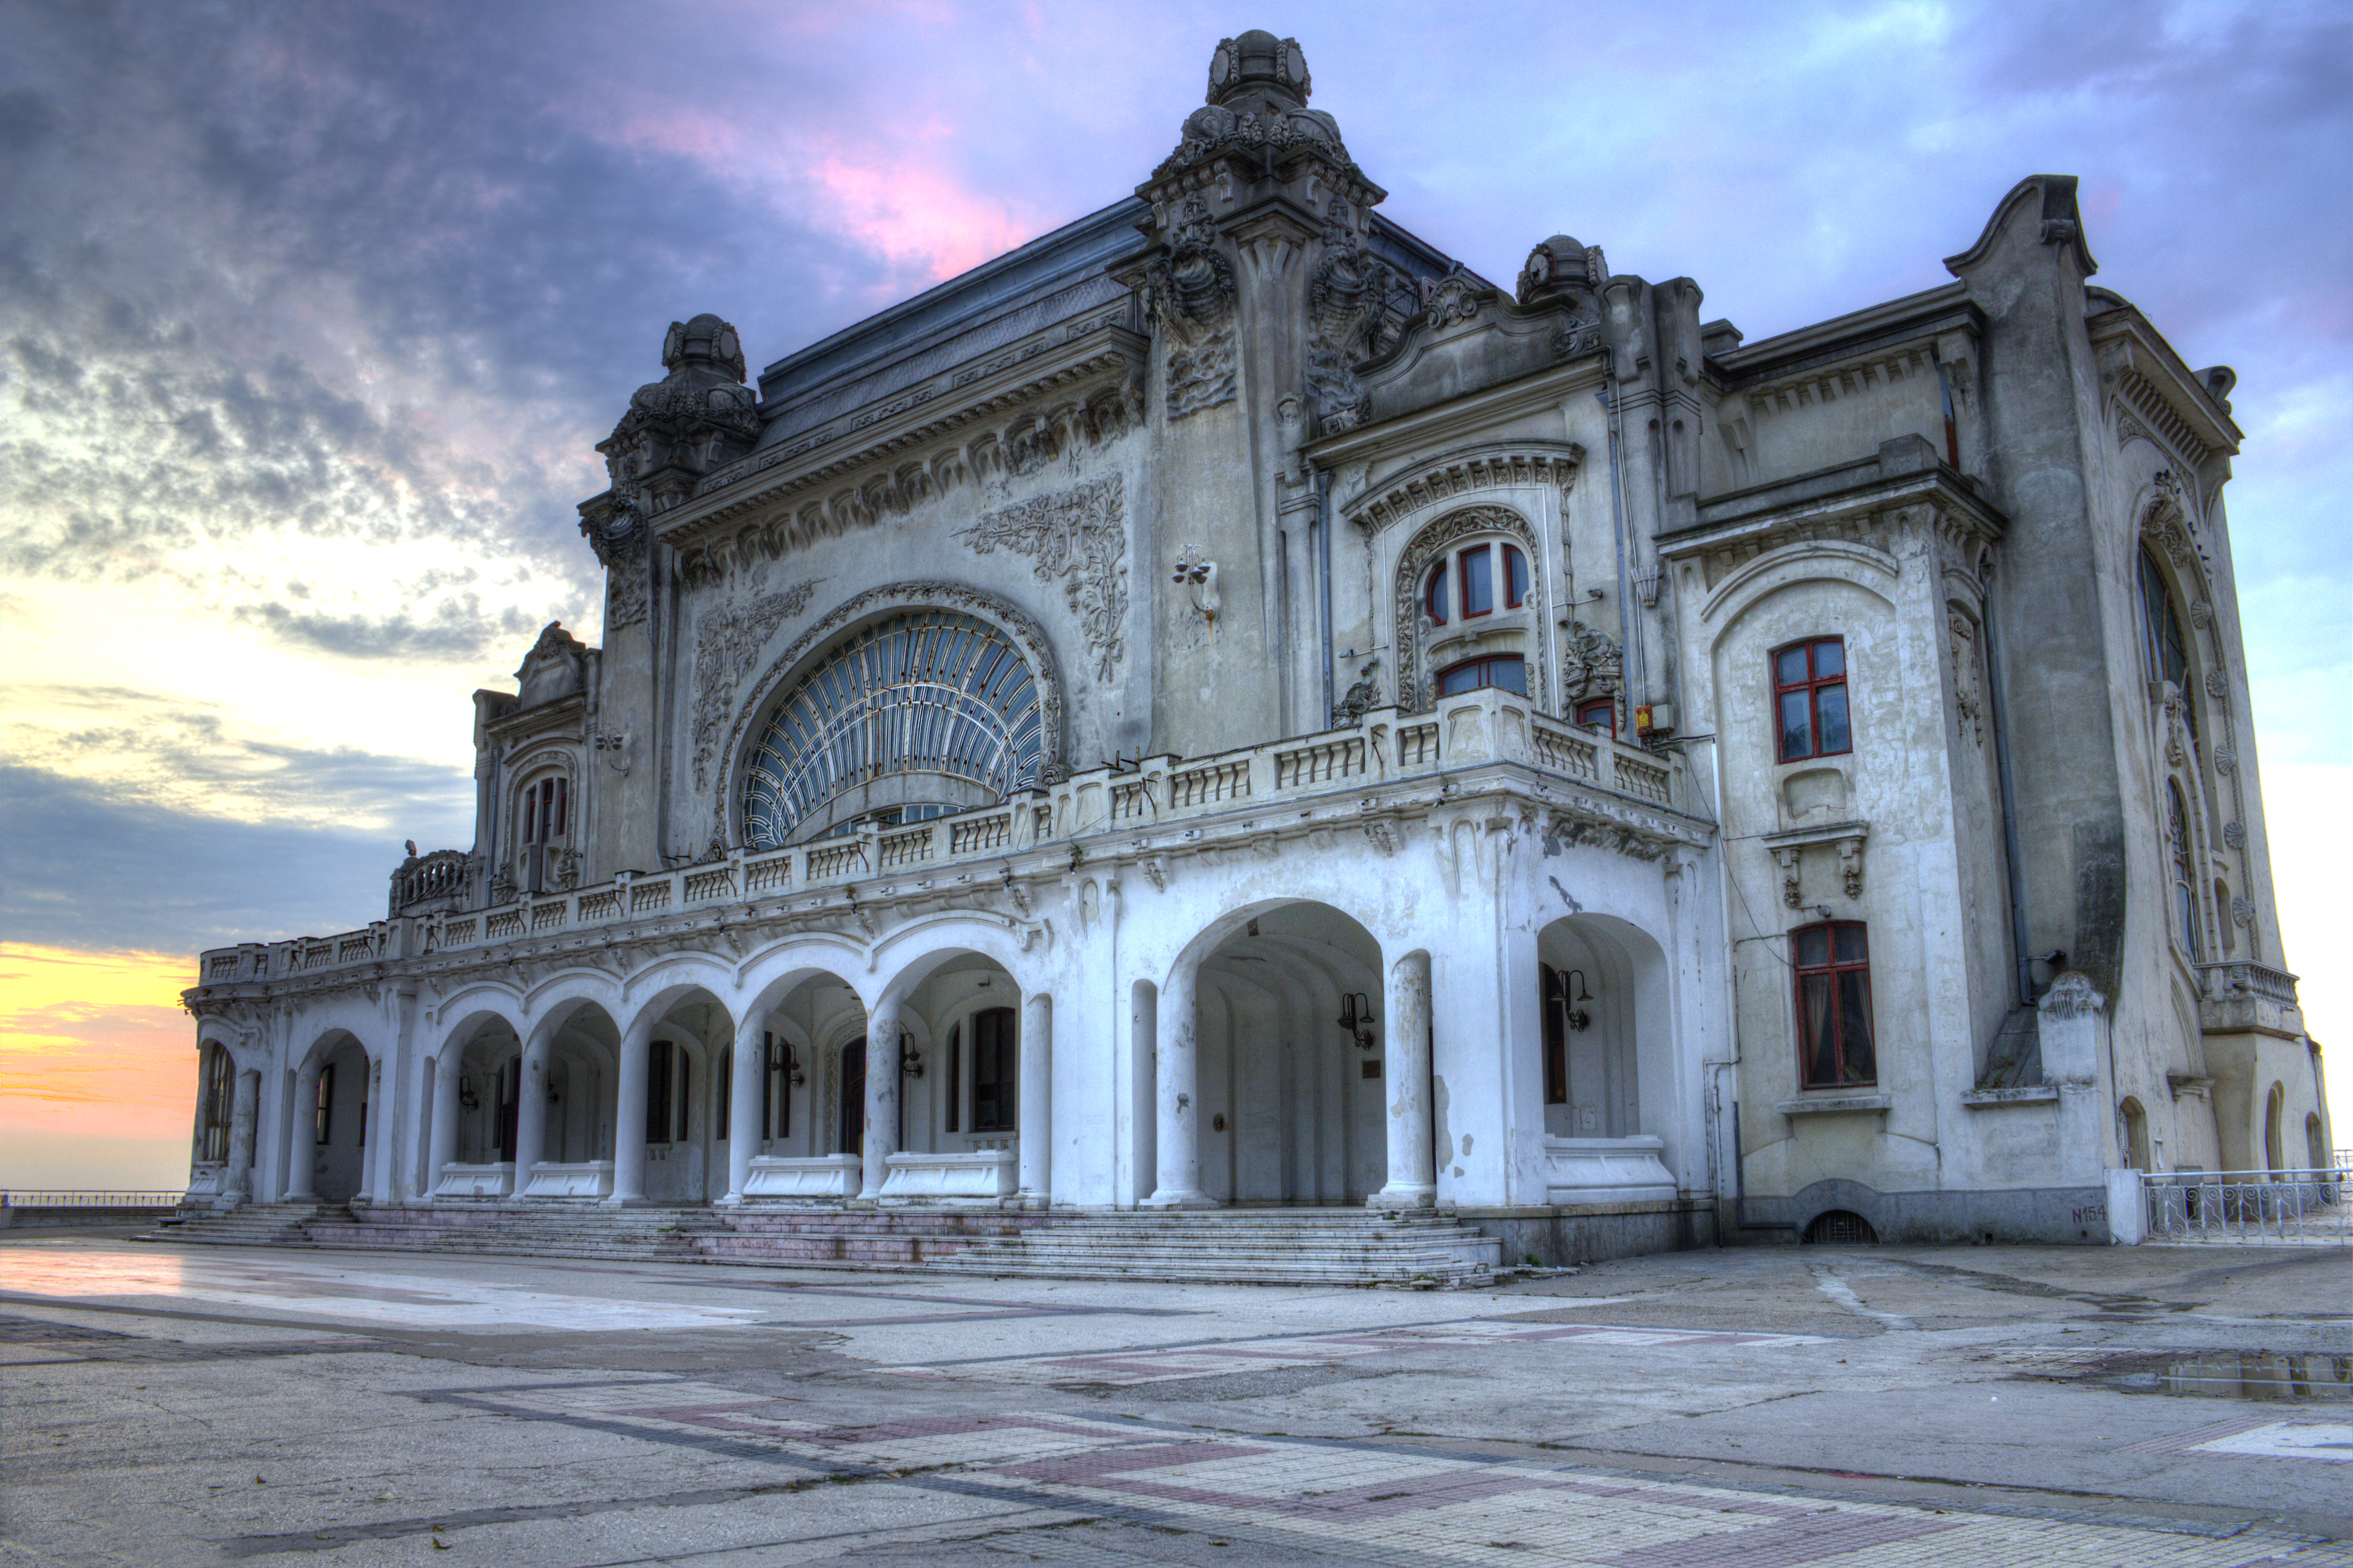
Mangalia
Mangalia (Romanian pronunciation: [maŋˈɡalia], Turkish: Mankalya, ancient Callatis (Greek: Κάλλατις/Καλλατίς), other historical names: Pangalia, Panglicara, Tomisovara), is a city and a port on the coast of the Black Sea in the south-east of Constanț..
Mangalia Wikipedia Page

About Our Data
The data on this page is estimated using a number of publicly available tools and resources. It is provided without warranty, and could contain inaccuracies. Use at your own risk.