Industries
Business Distribution by Industry in Minyar
| Industry Description | Number of Establishments |
|---|---|
| Education | 8 |
Minyar Facts
| Area | 5.5 km² |
| Population | 6,055 |
| Male Population | 2,769 (45.7%) |
| Female Population | 3,286 (54.3%) |
| Population change (1975 to 2020) | -14.8% |
| Population change (2000 to 2020) | -13.1% |
| Median Age | 37.9 years (Male: 34.8, Female: 40.9) |
| Local Time | |
| Timezone | Yekaterinburg Standard Time |
| Lat & Lng | 55.07333, 57.55500 |
| Postal Codes | 456007, 456008 |
Map of Minyar
Interactive Map
Minyar Population
Years 1975 to 2020
| Data | 1975 | 1990 | 2000 | 2015 | 2020 |
|---|---|---|---|---|---|
| Population | 7,109 | 7,577 | 6,966 | 6,311 | 6,055 |
| Population Density | 1,292.5 / km² | 1,377.6 / km² | 1,266.5 / km² | 1,147.5 / km² | 1,100.9 / km² |
Minyar Population change from 2000 to 2015
Decrease of 9.4% from year 2000 to 2015
| Location | Change since 1975 | Change since 1990 | Change since 2000 |
|---|---|---|---|
| Minyar | -11.2% | -16.7% | -9.4% |
| Chelyabinsk Oblast | -0.6% | -8.2% | -5.7% |
| Russia | +7.1% | -2.9% | -2% |
Minyar Median Age
Median Age: 37.9 years
| Location | Median Age | Median Age (Female) | Median Age (Male) |
|---|---|---|---|
| Minyar | 37.9 yrs | 40.9 yrs | 34.8 yrs |
| Chelyabinsk Oblast | 37.9 yrs | 40.9 yrs | 34.8 yrs |
| Russia | 38.2 yrs | 41.2 yrs | 35.1 yrs |
Minyar Population Density
Population Density: 1,101 / km²
| Location | Population | Area | Density |
|---|---|---|---|
| Minyar | 6,055 | 5.5 km² | 1,101 / km² |
| Chelyabinsk Oblast | 3.4 million | 88,679.4 km² | 38.8 / km² |
| Russia | 145.3 million | 16,974,452.8 km² | 8.6 / km² |
Minyar Historical and Projected Population
Estimated Population from 1740 to 2100
- JRC (European Commission's Joint Research Centre) work on the GHS built-up grid
- CIESIN (Center for International Earth Science Information Network)
- [Link] Klein Goldewijk, K., Beusen, A., Doelman, J., and Stehfest, E.: Anthropogenic land use estimates for the Holocene – HYDE 3.2, Earth Syst. Sci. Data, 9, 927–953, https://doi.org/10.5194/essd-9-927-2017, 2017.
Area Codes
Percentage Area Codes used by businesses in Minyar
Human Development Index (HDI)
Statistic composite index of life expectancy, education, and per capita income.
Minyar CO2 Emissions
Carbon Dioxide (CO2) Emissions Per Capita in Tonnes Per Year
| Location | CO2 Emissions | CO2 Emissions Per Capita | CO2 Emissions Intensity |
|---|---|---|---|
| Minyar | 53,510 tn | 8.84 tn | 9,729.1 tons/km² |
| Chelyabinsk Oblast | 28,962,514 tn | 8.42 tn | 326.6 tons/km² |
| Russia | 1,356,388,647 tn | 9.34 tn | 79.9 tons/km² |
| 2013 CO2 emissions (tonnes/year) | 53,510 tn |
| 2013 CO2 emissions (tonnes/year) per capita | 8.84 tn |
| 2013 CO2 emissions intensity (tonnes/km²/year) | 9,729.1 tons/km² |
Recent Nearby Earthquakes
Magnitude 3.0 and greater
| Date▼ | Time↕ | Magnitude↕ | Distance↕ | Depth↕ | Location↕ | Link |
|---|---|---|---|---|---|---|
| 11/15/18 | 7:48 AM | 4.4 | 43.2 km | 10,000 m | 11km WNW of Katav-Ivanovsk, Russia | usgs.gov |
| 9/29/18 | 9:06 AM | 4.4 | 46.7 km | 10,000 m | 11km W of Katav-Ivanovsk, Russia | usgs.gov |
| 9/5/18 | 7:27 AM | 4.2 | 51.8 km | 10,000 m | 13km WSW of Katav-Ivanovsk, Russia | usgs.gov |
| 9/4/18 | 10:58 PM | 5 | 40.1 km | 10,000 m | 15km WNW of Katav-Ivanovsk, Russia | usgs.gov |
| 5/28/90 | 2:41 AM | 4.5 | 73.4 km | 33,000 m | Ural Mountains region, Russia | usgs.gov |
| 5/28/90 | 12:35 AM | 4.5 | 75.7 km | 33,000 m | Ural Mountains region, Russia | usgs.gov |
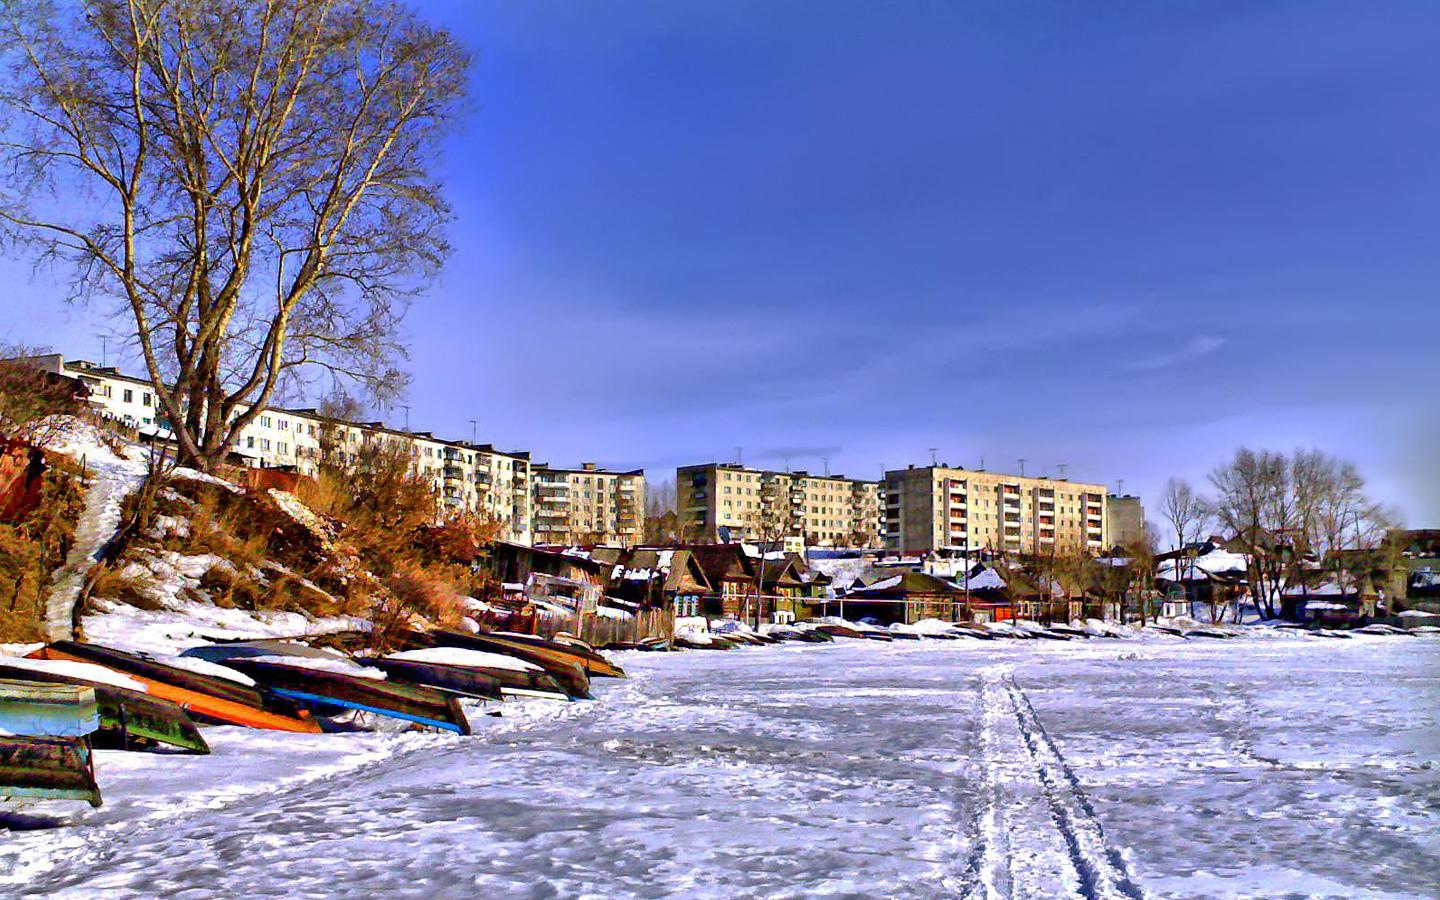
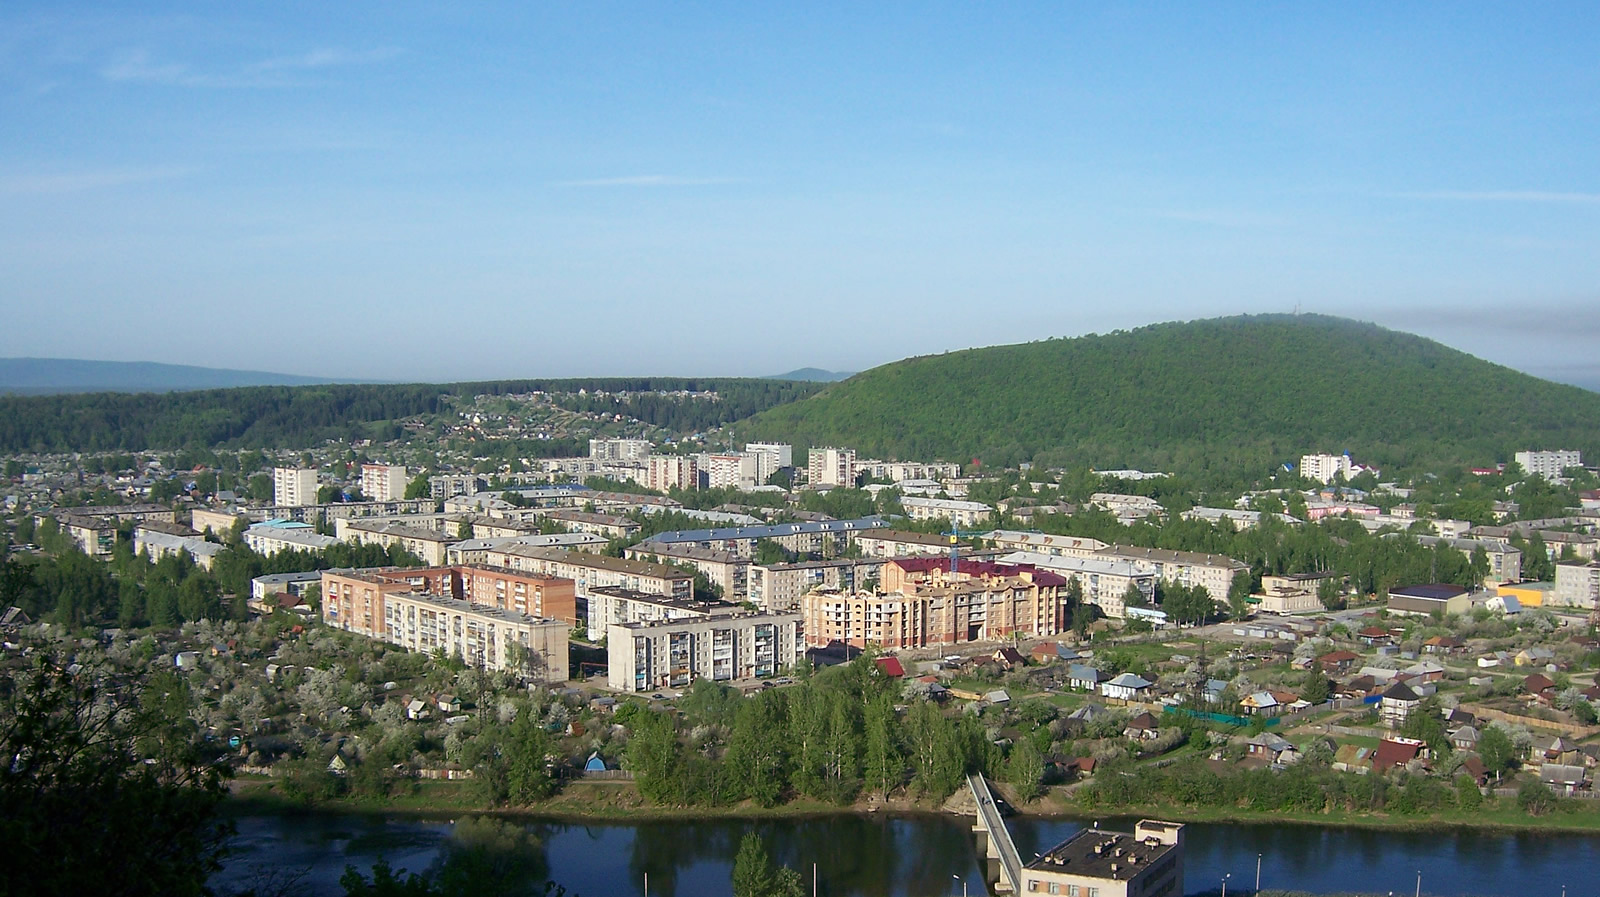
Minyar
Minyar (Russian: Минья́р) is a town in Ashinsky District of Chelyabinsk Oblast, Russia, located in the valley of the Sim River at its confluence with the Minyar River, 370 kilometers (230 mi) west of Chelyabinsk, the administrative center of the obla..
Minyar Wikipedia Page

About Our Data
The data on this page is estimated using a number of publicly available tools and resources. It is provided without warranty, and could contain inaccuracies. Use at your own risk.