Industries
Business Distribution by Industry in Polazna
Polazna Facts
| Area | 4.0 km² |
| Population | 2,828 |
| Population change (1975 to 2020) | -66.7% |
| Population change (2000 to 2020) | -45.0% |
| Local Time | |
| Timezone | Yekaterinburg Standard Time |
| Lat & Lng | 58.29220, 56.41560 |
| Postal Codes | 618703 |
Map of Polazna
Interactive Map
Polazna Population
Years 1975 to 2020
| Data | 1975 | 1990 | 2000 | 2015 | 2020 |
|---|---|---|---|---|---|
| Population | 8,498 | 7,222 | 5,143 | 2,959 | 2,828 |
| Population Density | 2,124.5 / km² | 1,805.5 / km² | 1,285.8 / km² | 739.8 / km² | 707 / km² |
Polazna Population change from 2000 to 2015
Decrease of 42.5% from year 2000 to 2015
| Location | Change since 1975 | Change since 1990 | Change since 2000 |
|---|---|---|---|
| Polazna | -65.2% | -59% | -42.5% |
| Perm Krai | -15% | -16.8% | -11.1% |
| Russia | +7.1% | -2.9% | -2% |
Polazna Population Density
Population Density: 707 / km²
| Location | Population | Area | Density |
|---|---|---|---|
| Polazna | 2,828 | 4 km² | 707 / km² |
| Perm Krai | 2.5 million | 161,108.2 km² | 15.8 / km² |
| Russia | 145.3 million | 16,974,452.8 km² | 8.6 / km² |
Polazna Historical and Projected Population
Estimated Population from 100 to 2100
- JRC (European Commission's Joint Research Centre) work on the GHS built-up grid
- CIESIN (Center for International Earth Science Information Network)
- [Link] Klein Goldewijk, K., Beusen, A., Doelman, J., and Stehfest, E.: Anthropogenic land use estimates for the Holocene – HYDE 3.2, Earth Syst. Sci. Data, 9, 927–953, https://doi.org/10.5194/essd-9-927-2017, 2017.
Area Codes
Percentage Area Codes used by businesses in Polazna
Postal Codes
Percentage of businesses by Postal Codes in Polazna
Price Distribution
Business distribution by price for Polazna
Human Development Index (HDI)
Statistic composite index of life expectancy, education, and per capita income.
Polazna CO2 Emissions
Carbon Dioxide (CO2) Emissions Per Capita in Tonnes Per Year
| Location | CO2 Emissions | CO2 Emissions Per Capita | CO2 Emissions Intensity |
|---|---|---|---|
| Polazna | 30,428 tn | 10.76 tn | 7,607.1 tons/km² |
| Perm Krai | 22,988,978 tn | 9.02 tn | 142.7 tons/km² |
| Russia | 1,356,388,647 tn | 9.34 tn | 79.9 tons/km² |
| 2013 CO2 emissions (tonnes/year) | 30,428 tn |
| 2013 CO2 emissions (tonnes/year) per capita | 10.76 tn |
| 2013 CO2 emissions intensity (tonnes/km²/year) | 7,607.1 tons/km² |
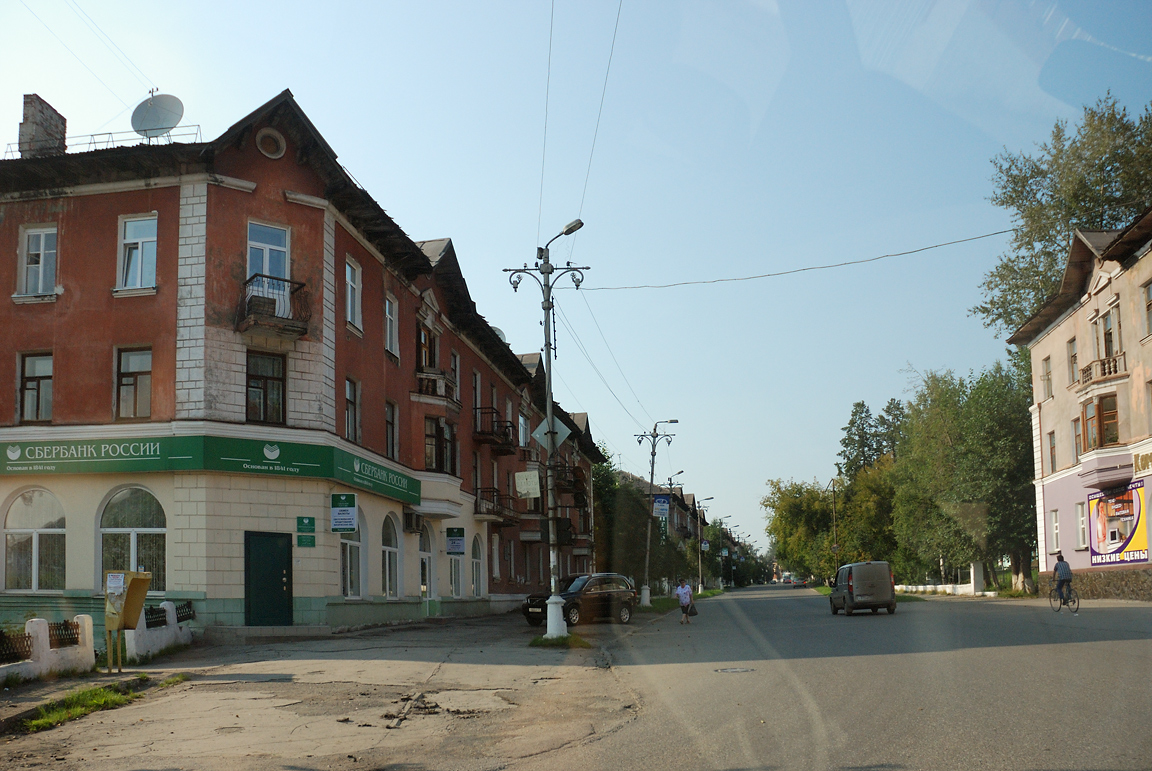
Polazna
Polazna (Russian: Пола́зна) is an urban locality (an urban-type settlement) under the administrative jurisdiction of the Town of Dobryanka in Perm Krai, Russia, located on the east bank of Kama Reservoir, 45 kilometers (28 mi) north of Perm and 25 ki..
Polazna Wikipedia Page
About Our Data
The data on this page is estimated using a number of publicly available tools and resources. It is provided without warranty, and could contain inaccuracies. Use at your own risk.