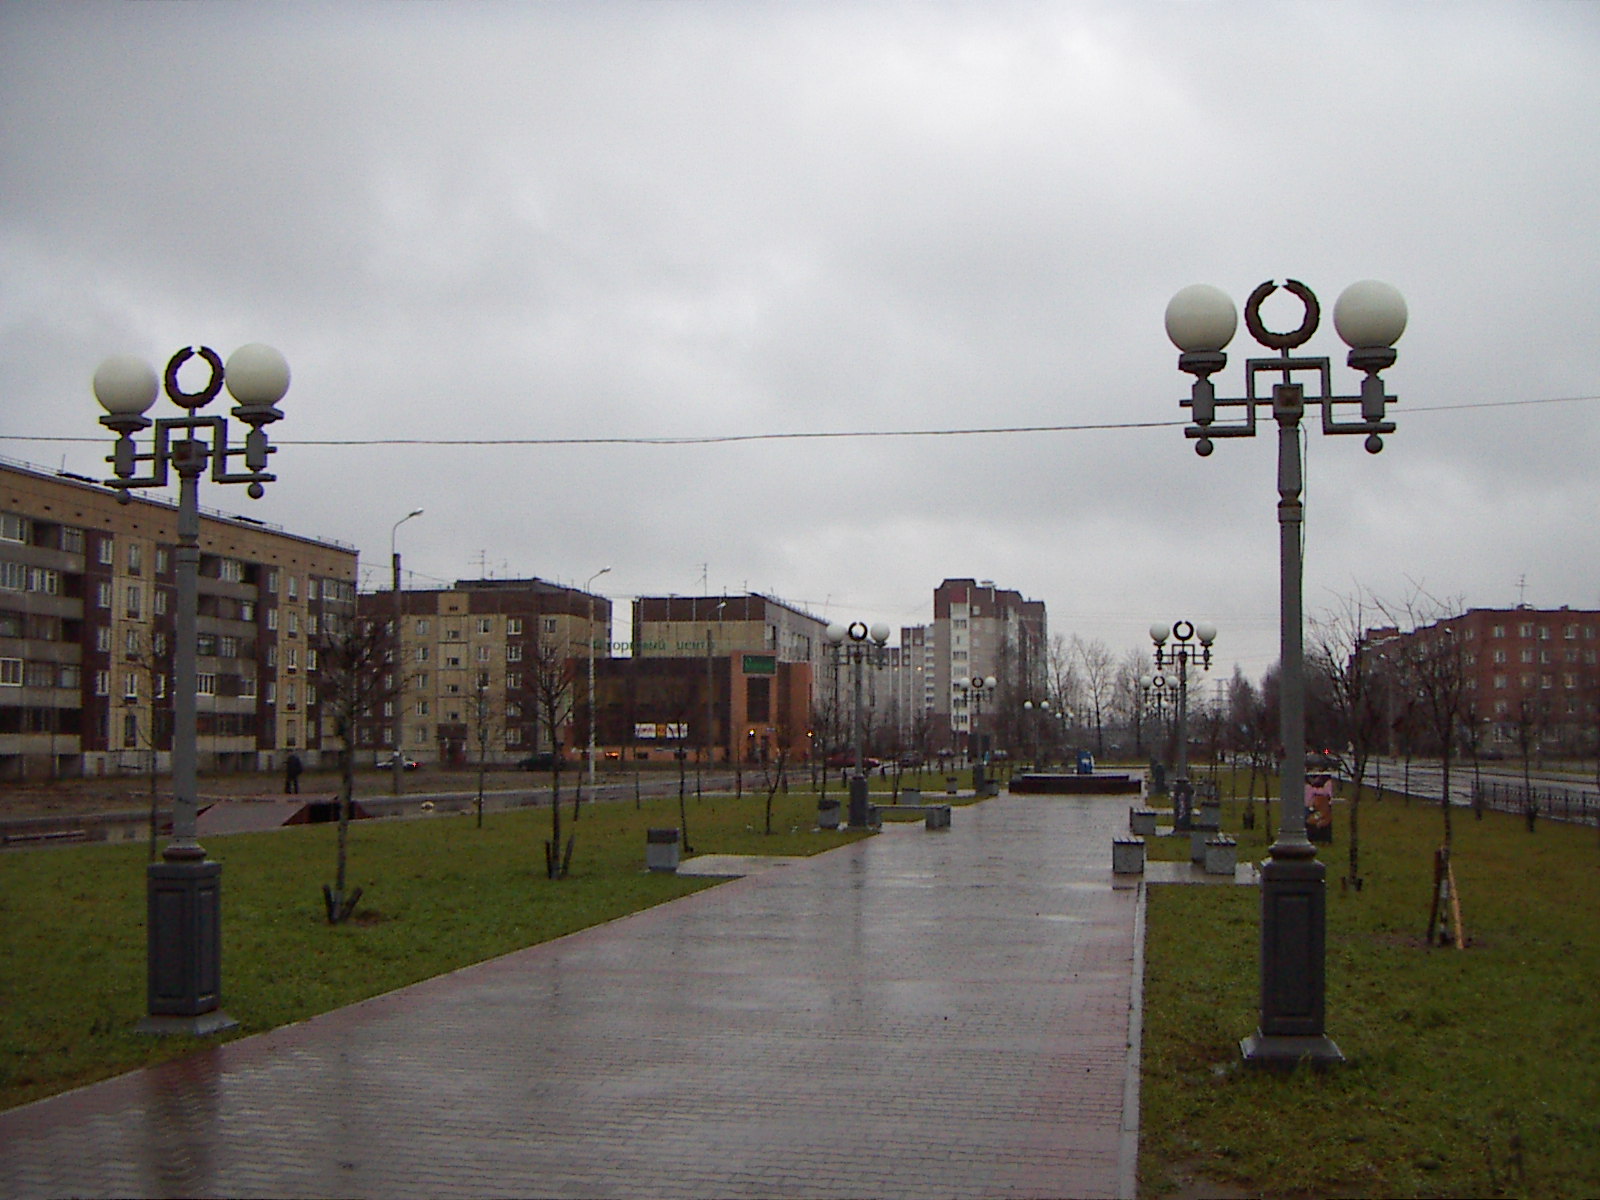
Categories in Pushkin
Industries
Business Distribution by Industry in Pushkin
| Industry Description | Number of Establishments |
|---|---|
| Shopping | 70 |
| Education | 33 |
| Shopping other | 32 |
| Grocery stores and supermarkets | 30 |
| Restaurants | 29 |
| Clothing stores | 29 |
| Construction of buildings | 29 |
| Real estate | 29 |
| Car repair | 27 |
| Beauty salons | 26 |
| Banks | 25 |
| Buses and trains | 22 |
| Wholesale of machinery | 21 |
| Wholesale of construction supplies | 21 |
| Travel agencies | 19 |
| Household appliances and goods | 19 |
| Libraries | 18 |
| Parking lots and garages | 17 |
| Atm's | 17 |
| Post office | 17 |
| Pharmacies and drug stores | 16 |
Pushkin Facts
| Area | 8.4 km² |
| Population | 31,528 |
| Male Population | 14,143 (44.9%) |
| Female Population | 17,385 (55.1%) |
| Population change (1975 to 2020) | +39.5% |
| Population change (2000 to 2020) | +8.8% |
| Median Age | 40.5 years (Male: 36.6, Female: 44.4) |
| Neighborhoods | Пушкинский, Svetlanovskoye Municipal Okrug, Zvyozdnoye Municipal Okrug, Sampsoniyevskoye Municipal Okrug, Akademicheskoye Municipal Okrug |
| Local Time | |
| Timezone | Moscow Standard Time |
| Lat & Lng | 59.71417, 30.39642 |
| Postal Codes | 196600, 196601, 196602, 196603, 196604, More |
Map of Pushkin
Interactive Map
Pushkin Population
Years 1975 to 2020
| Data | 1975 | 1990 | 2000 | 2015 | 2020 |
|---|---|---|---|---|---|
| Population | 22,594 | 27,573 | 28,965 | 30,988 | 31,528 |
| Population Density | 2,677.8 / km² | 3,267.9 / km² | 3,432.9 / km² | 3,672.7 / km² | 3,736.7 / km² |
Pushkin Population change from 2000 to 2015
Increase of 7% from year 2000 to 2015
| Location | Change since 1975 | Change since 1990 | Change since 2000 |
|---|---|---|---|
| Pushkin | +37.2% | +12.4% | +7% |
| Russia | +7.1% | -2.9% | -2% |
Pushkin Median Age
Median Age: 40.5 years
| Location | Median Age | Median Age (Female) | Median Age (Male) |
|---|---|---|---|
| Pushkin | 40.5 yrs | 44.4 yrs | 36.6 yrs |
| Russia | 38.2 yrs | 41.2 yrs | 35.1 yrs |
Pushkin Population Density
Population Density: 3,737 / km²
| Location | Population | Area | Density |
|---|---|---|---|
| Pushkin | 31,528 | 8.4 km² | 3,737 / km² |
| Russia | 145.3 million | 16,974,452.8 km² | 8.6 / km² |
Pushkin Historical and Projected Population
Estimated Population from 1200 to 2100
- JRC (European Commission's Joint Research Centre) work on the GHS built-up grid
- CIESIN (Center for International Earth Science Information Network)
- [Link] Klein Goldewijk, K., Beusen, A., Doelman, J., and Stehfest, E.: Anthropogenic land use estimates for the Holocene – HYDE 3.2, Earth Syst. Sci. Data, 9, 927–953, https://doi.org/10.5194/essd-9-927-2017, 2017.
Neighborhoods in Pushkin
Percentage of businesses by neighborhood in Pushkin
Area Codes
Percentage Area Codes used by businesses in Pushkin
Postal Codes
Percentage of businesses by Postal Codes in Pushkin
Price Distribution
Business distribution by price for Pushkin
Human Development Index (HDI)
Statistic composite index of life expectancy, education, and per capita income.
Pushkin CO2 Emissions
Carbon Dioxide (CO2) Emissions Per Capita in Tonnes Per Year
| Location | CO2 Emissions | CO2 Emissions Per Capita | CO2 Emissions Intensity |
|---|---|---|---|
| Pushkin | 419,889 tn | 13.32 tn | 49,764.6 tons/km² |
| Russia | 1,356,388,647 tn | 9.34 tn | 79.9 tons/km² |
| 2013 CO2 emissions (tonnes/year) | 419,889 tn |
| 2013 CO2 emissions (tonnes/year) per capita | 13.32 tn |
| 2013 CO2 emissions intensity (tonnes/km²/year) | 49,764.6 tons/km² |
Tsarskoye Selo
Selo (Russian: Ца́рское Село́; IPA: [ˈtsarskəɪ sʲɪˈlo]; "Tsar's Village") was the town containing a former Russian residence of the imperial family and visiting nobility, located 24 kilometers (15 mi) south from the center of Saint Petersburg. It i..
Tsarskoye Selo Wikipedia Page

About Our Data
The data on this page is estimated using a number of publicly available tools and resources. It is provided without warranty, and could contain inaccuracies. Use at your own risk.