Categories in Hofors
Industries
Business Distribution by Industry in Hofors
| Industry Description | Number of Establishments | Average Age of Business |
|---|---|---|
| Other membership organizations | 71 | 39 years |
| Education | 38 | — |
| Restaurants | 34 | 21 years |
| Corporate management | 31 | 28 years |
| Shopping | 29 | 24 years |
| Construction of buildings | 28 | 24 years |
| Wholesale of machinery | 23 | 36 years |
| Unreachable | 21 | 25 years |
| Car repair | 18 | — |
| Real estate | 18 | 38 years |
| Shopping other | 18 | 21 years |
| Beauty salons | 17 | — |
| Technical construction services | 15 | 35 years |
| Buses and trains | 14 | — |
| Electronics stores | 14 | 20 years |
| Advertising and marketing | 14 | 31 years |
Hofors Facts
| Area | 7.2 km² |
| Population | 5,729 |
| Male Population | 2,911 (50.8%) |
| Female Population | 2,818 (49.2%) |
| Population change (1975 to 2020) | -40.0% |
| Population change (2000 to 2020) | -14.5% |
| Median Age | 46.6 years (Male: 45.6, Female: 47.8) |
| Area Codes | 290 |
| Neighborhoods | Korsån |
| Local Time | |
| Timezone | Central European Summer Time |
| Lat & Lng | 60.54573, 16.28668 |
| Postal Codes | 813 01, 813 20, 813 21, 813 22, 813 23, More |
Map of Hofors
Interactive Map
Hofors Population
Years 1975 to 2020
| Data | 1975 | 1990 | 2000 | 2015 | 2020 |
|---|---|---|---|---|---|
| Population | 9,543 | 7,719 | 6,699 | 5,482 | 5,729 |
| Population Density | 1,327.7 / km² | 1,073.9 / km² | 932 / km² | 762.7 / km² | 797.1 / km² |
Hofors Population change from 2000 to 2015
Decrease of 18.2% from year 2000 to 2015
| Location | Change since 1975 | Change since 1990 | Change since 2000 |
|---|---|---|---|
| Hofors | -42.6% | -29% | -18.2% |
| Gävleborg County | -9.7% | -4.9% | -1.6% |
| Sweden | +19.2% | +14.2% | +10.2% |
Hofors Median Age
Median Age: 46.6 years
| Location | Median Age | Median Age (Female) | Median Age (Male) |
|---|---|---|---|
| Hofors | 46.6 yrs | 47.8 yrs | 45.6 yrs |
| Gävleborg County | 44.3 yrs | 45.4 yrs | 43.2 yrs |
| Sweden | 40.8 yrs | 41.8 yrs | 39.8 yrs |
Hofors Population Density
Population Density: 797 / km²
| Location | Population | Area | Density |
|---|---|---|---|
| Hofors | 5,729 | 7.2 km² | 797 / km² |
| Gävleborg County | 273,598 | 25,142.5 km² | 10.9 / km² |
| Sweden | 9.6 million | 449,151.6 km² | 21.3 / km² |
Hofors Historical and Projected Population
Estimated Population from 400 to 2100
- JRC (European Commission's Joint Research Centre) work on the GHS built-up grid
- CIESIN (Center for International Earth Science Information Network)
- [Link] Klein Goldewijk, K., Beusen, A., Doelman, J., and Stehfest, E.: Anthropogenic land use estimates for the Holocene – HYDE 3.2, Earth Syst. Sci. Data, 9, 927–953, https://doi.org/10.5194/essd-9-927-2017, 2017.
Area Codes
Percentage Area Codes used by businesses in Hofors
Postal Codes
Percentage of businesses by Postal Codes in Hofors
Price Distribution
Business distribution by price for Hofors
Human Development Index (HDI)
Statistic composite index of life expectancy, education, and per capita income.
Hofors CO2 Emissions
Carbon Dioxide (CO2) Emissions Per Capita in Tonnes Per Year
| Location | CO2 Emissions | CO2 Emissions Per Capita | CO2 Emissions Intensity |
|---|---|---|---|
| Hofors | 54,944 tn | 9.59 tn | 7,644.4 tons/km² |
| Gävleborg County | 2,079,923 tn | 7.6 tn | 82.7 tons/km² |
| Sweden | 93,354,240 tn | 9.75 tn | 207.8 tons/km² |
| 2013 CO2 emissions (tonnes/year) | 54,944 tn |
| 2013 CO2 emissions (tonnes/year) per capita | 9.59 tn |
| 2013 CO2 emissions intensity (tonnes/km²/year) | 7,644.4 tons/km² |
Natural Hazards Risk
Relative risk out of 10
| Hazard | Risk Level |
|---|---|
| Drought | Medium (4) |
* Risk, particularly concerning flood or landslide, may not be for the entire area.
- Dilley, M., R.S. Chen, U. Deichmann, A.L. Lerner-Lam, M. Arnold, J. Agwe, P. Buys, O. Kjekstad, B. Lyon, and G. Yetman. 2005. Natural Disaster Hotspots: A Global Risk Analysis. Washington, D.C.: World Bank. https://doi.org/10.1596/0-8213-5930-4.
- Center for Hazards and Risk Research - CHRR - Columbia University, Center for International Earth Science Information Network - CIESIN - Columbia University, and International Research Institute for Climate and Society - IRI - Columbia University. 2005. Global Drought Hazard Frequency and Distribution. Palisades, NY: NASA Socioeconomic Data and Applications Center (SEDAC). https://doi.org/10.7927/H4VX0DFT.
Recent Nearby Earthquakes
Magnitude 3.0 and greater
| Date▼ | Time↕ | Magnitude↕ | Distance↕ | Depth↕ | Location↕ | Link |
|---|---|---|---|---|---|---|
| 4/11/93 | 8:14 PM | 3.7 | 73.1 km | 10,000 m | Sweden | usgs.gov |
| 12/12/90 | 3:27 PM | 3.9 | 89.5 km | 10,000 m | Sweden | usgs.gov |
| 9/20/86 | 10:15 PM | 3.6 | 83.2 km | 10,000 m | Sweden | usgs.gov |
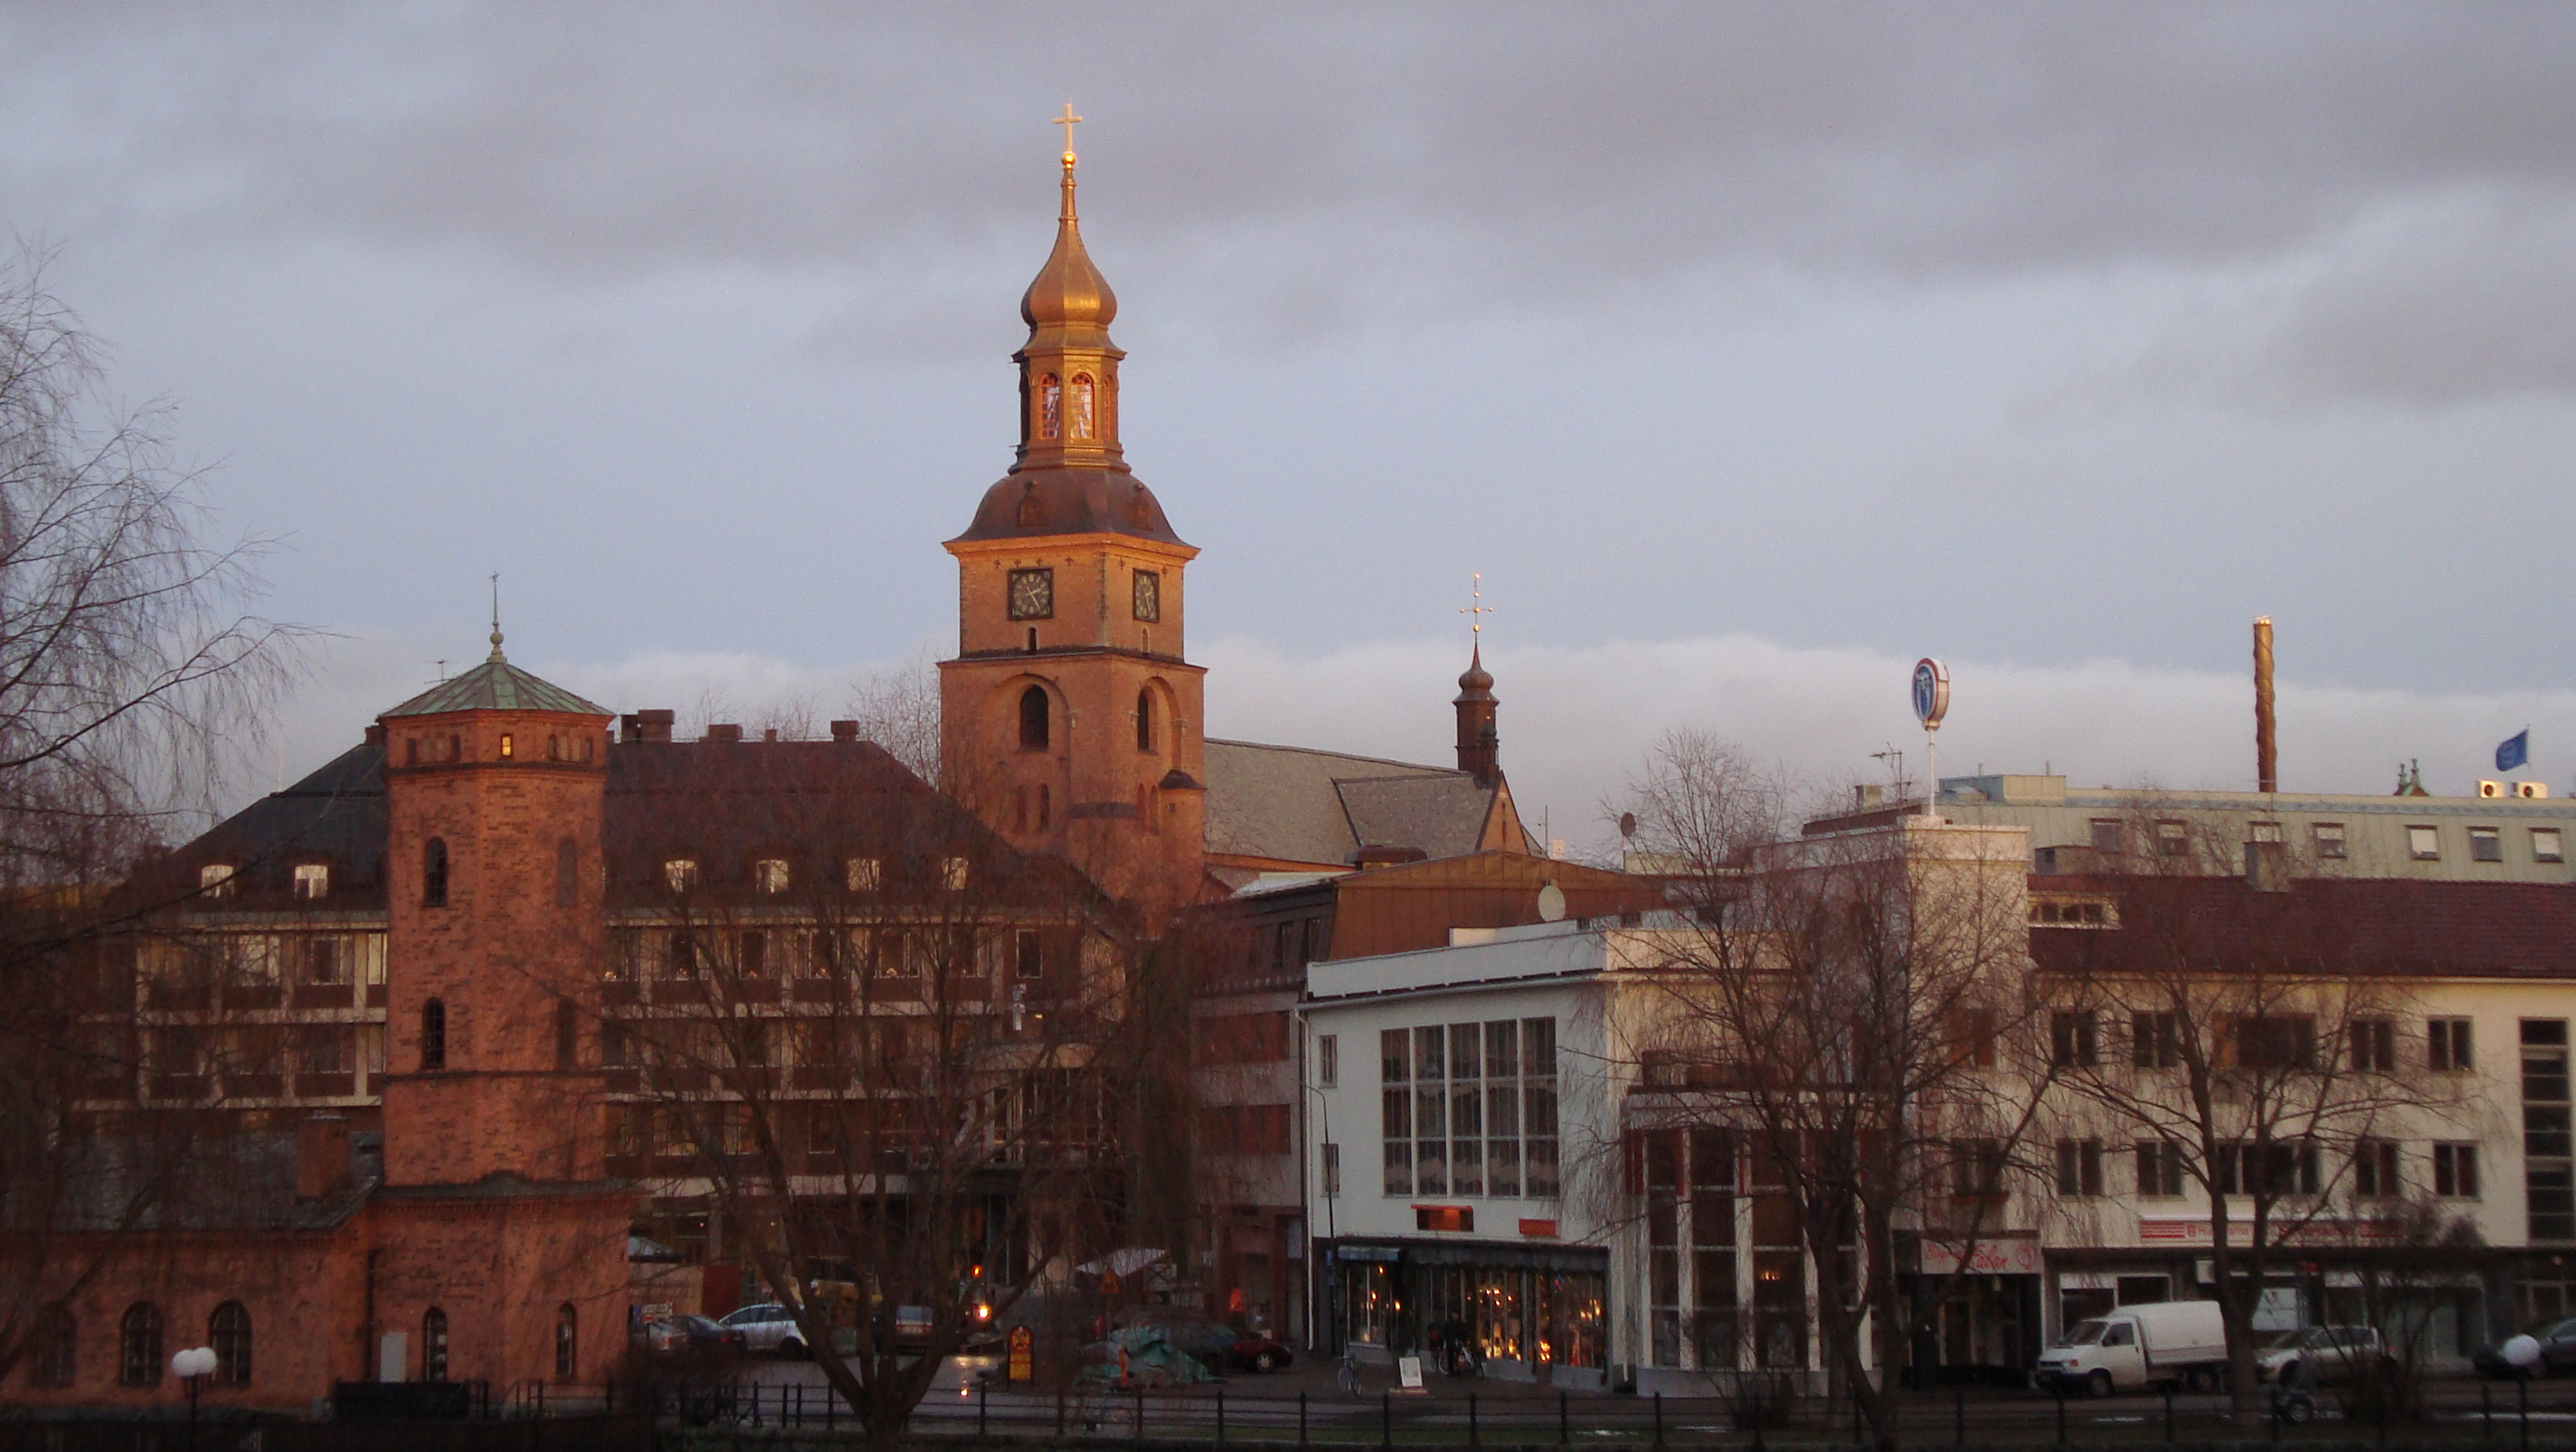
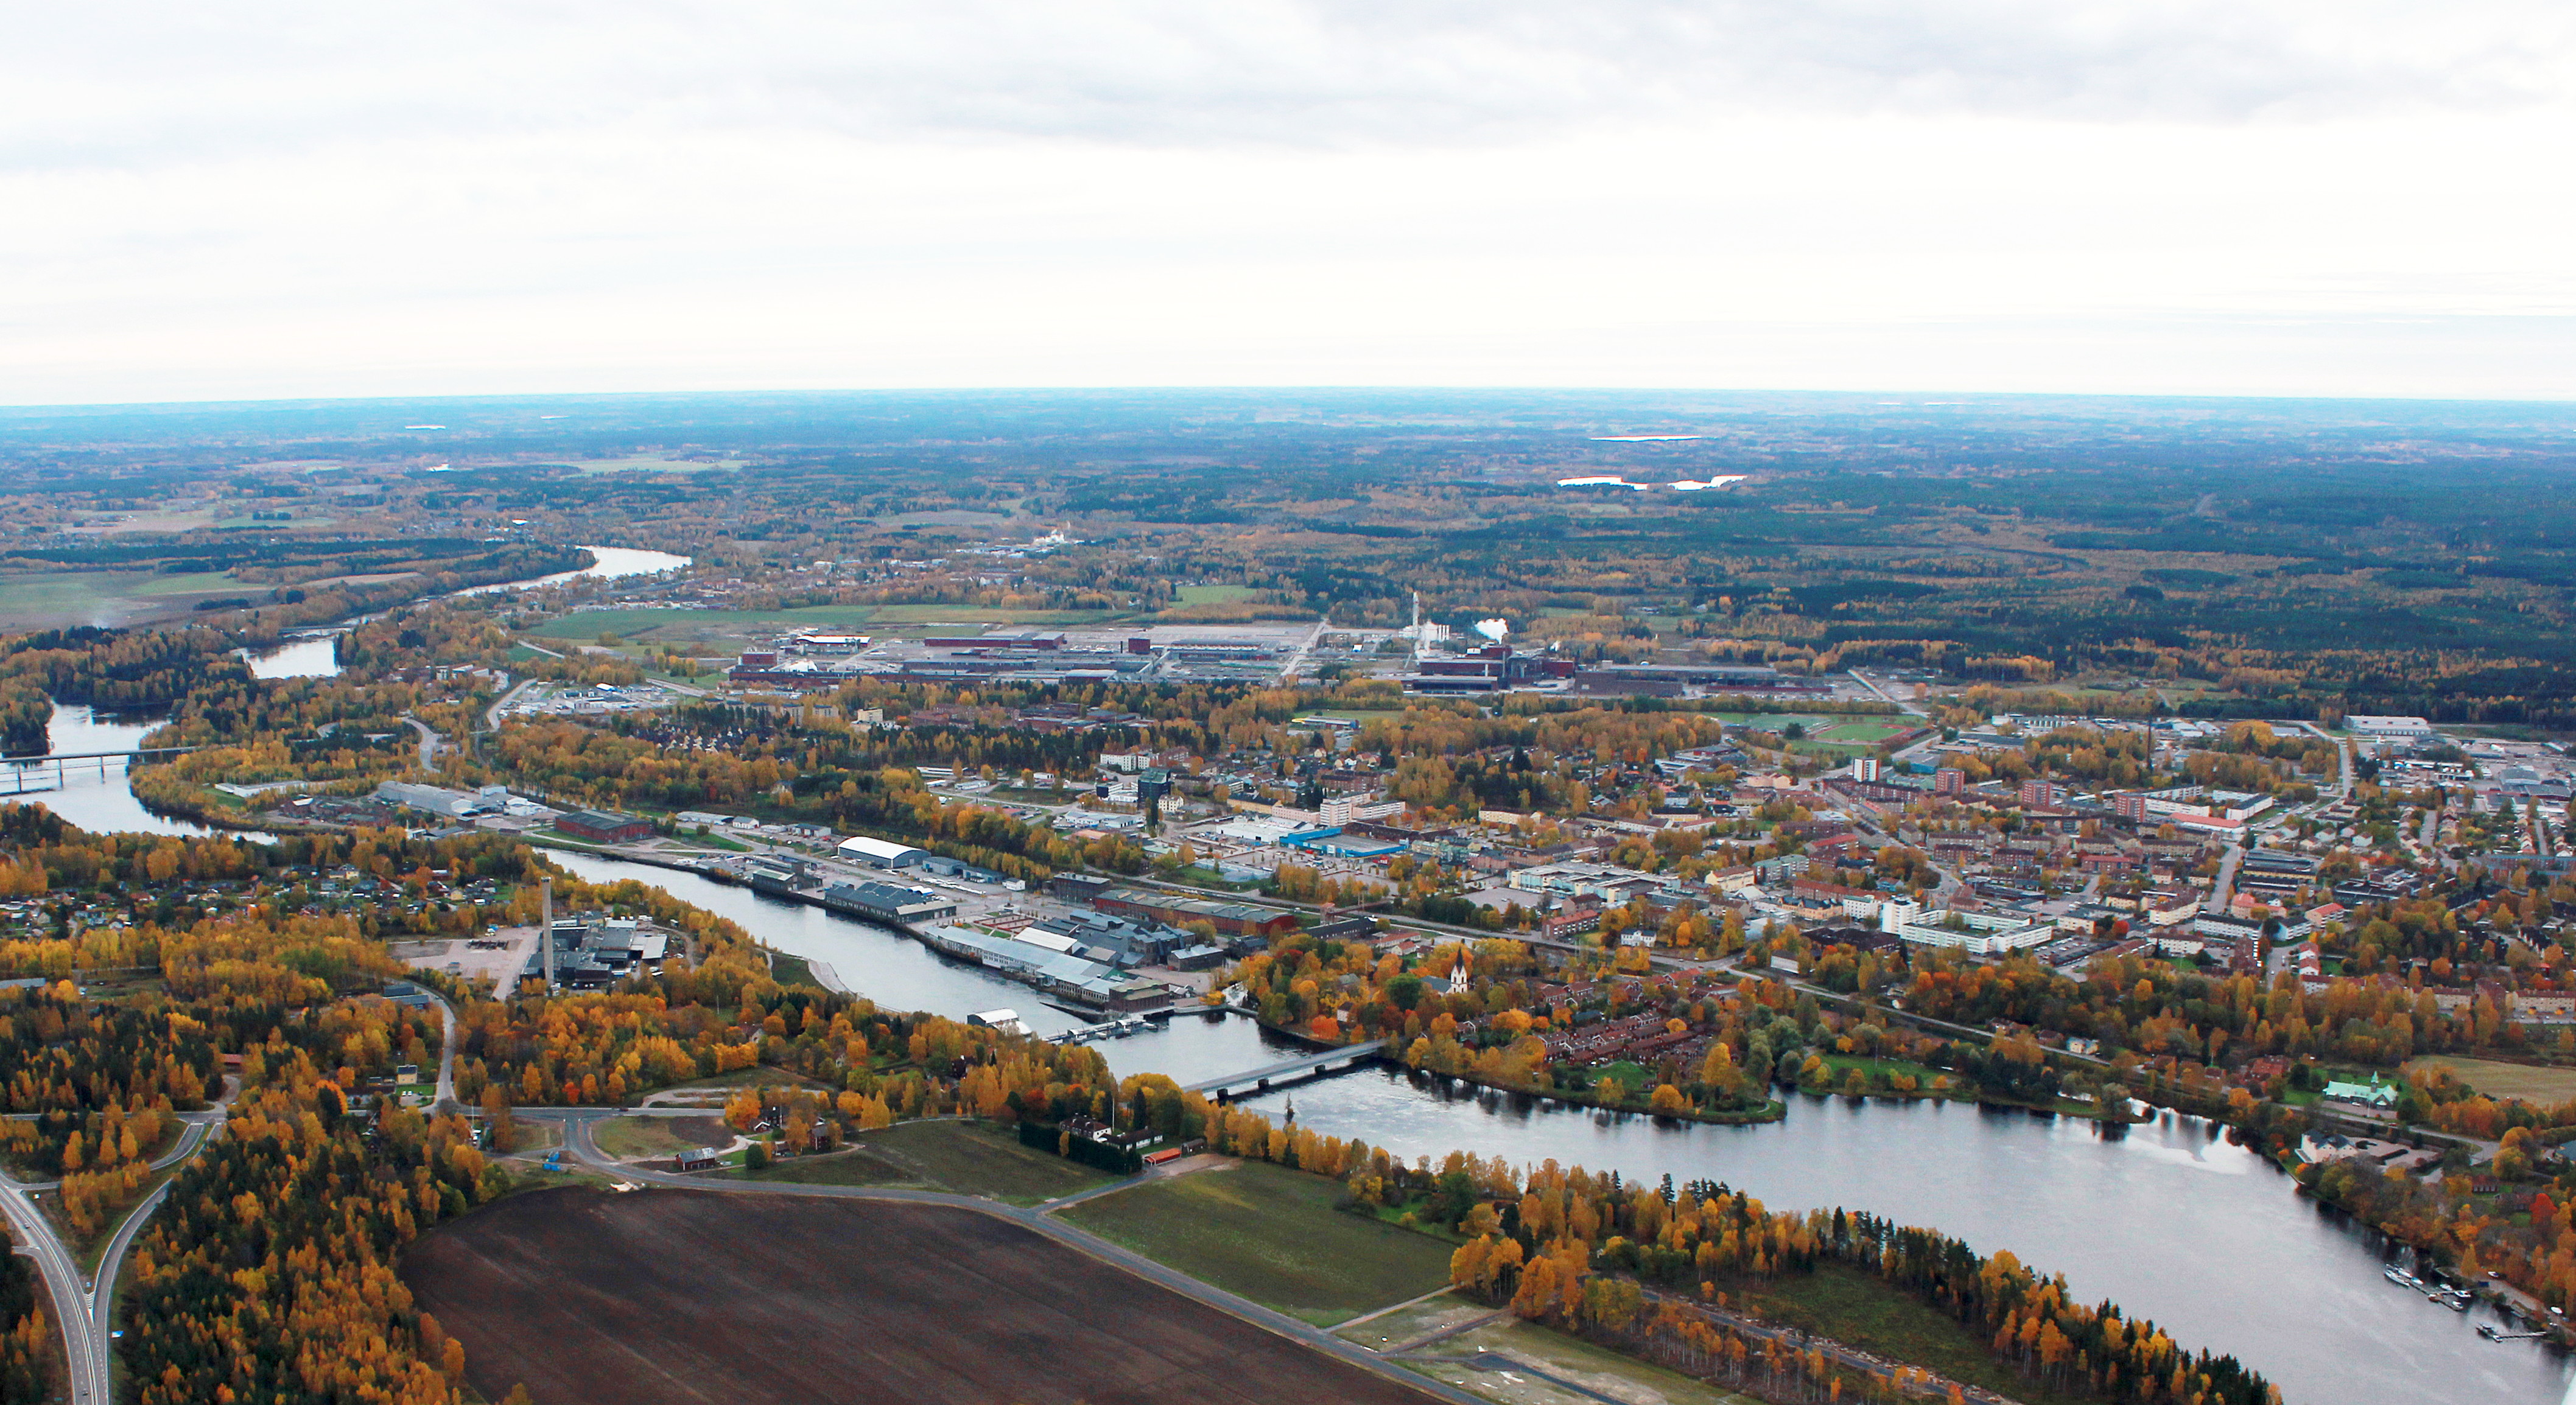
Hofors
Hofors is a locality and the seat of Hofors Municipality, Gävleborg County, Sweden with 6,681 inhabitants in 2010.
Hofors Wikipedia Page

About Our Data
The data on this page is estimated using a number of publicly available tools and resources. It is provided without warranty, and could contain inaccuracies. Use at your own risk.