Nås Facts
| Area | 2.4 km² |
| Population | 187 |
| Population change (1975 to 2020) | -48.6% |
| Population change (2000 to 2020) | -19.4% |
| Local Time | |
| Timezone | Central European Summer Time |
| Lat & Lng | 60.45000, 14.48333 |
Map of Nås
Interactive Map
Nås Population
Years 1975 to 2020
| Data | 1975 | 1990 | 2000 | 2015 | 2020 |
|---|---|---|---|---|---|
| Population | 364 | 277 | 232 | 181 | 187 |
| Population Density | 153.3 / km² | 116.6 / km² | 97.7 / km² | 76.2 / km² | 78.7 / km² |
Sources: JRC (European Commission's Joint Research Centre) work on the GHS built-up grid
Nås Population change from 2000 to 2015
Decrease of 22% from year 2000 to 2015
| Location | Change since 1975 | Change since 1990 | Change since 2000 |
|---|---|---|---|
| Nås | -50.3% | -34.7% | -22% |
| Dalarna County | -7.4% | -3.4% | -0.7% |
| Sweden | +19.2% | +14.2% | +10.2% |
Sources: JRC (European Commission's Joint Research Centre) work on the GHS built-up grid
Nås Population Density
Population Density: 78.7 / km²
| Location | Population | Area | Density |
|---|---|---|---|
| Nås | 187 | 2.375 km² | 78.7 / km² |
| Dalarna County | 275,878 | 30,386.9 km² | 9.1 / km² |
| Sweden | 9.6 million | 449,151.6 km² | 21.3 / km² |
Sources: JRC (European Commission's Joint Research Centre) work on the GHS built-up grid
Nås Historical and Projected Population
Estimated Population from 0 to 2100
Sources:
- JRC (European Commission's Joint Research Centre) work on the GHS built-up grid
- CIESIN (Center for International Earth Science Information Network)
- [Link] Klein Goldewijk, K., Beusen, A., Doelman, J., and Stehfest, E.: Anthropogenic land use estimates for the Holocene – HYDE 3.2, Earth Syst. Sci. Data, 9, 927–953, https://doi.org/10.5194/essd-9-927-2017, 2017.
Human Development Index (HDI)
Statistic composite index of life expectancy, education, and per capita income.
Source: [Link] Kummu, M., Taka, M. &Guillaume, J. Gridded global datasets for Gross Domestic Product and Human Development Index over 1990–2015. Sci Data 5, 180004 (2018) doi:10.1038/sdata.2018.4
Nås CO2 Emissions
Carbon Dioxide (CO2) Emissions Per Capita in Tonnes Per Year
| Location | CO2 Emissions | CO2 Emissions Per Capita | CO2 Emissions Intensity |
|---|---|---|---|
| Nås | 1,826 tn | 9.76 tn | 768.8 tons/km² |
| Dalarna County | 2,693,850 tn | 9.76 tn | 88.7 tons/km² |
| Sweden | 93,354,240 tn | 9.75 tn | 207.8 tons/km² |
Sources: [Link] Moran, D., Kanemoto K; Jiborn, M., Wood, R., Többen, J., and Seto, K.C. (2018) Carbon footprints of 13,000 cities. Environmental Research Letters DOI: 10.1088/1748-9326/aac72a
Nås CO2 Emissions
| 2013 CO2 emissions (tonnes/year) | 1,826 tn |
| 2013 CO2 emissions (tonnes/year) per capita | 9.76 tn |
| 2013 CO2 emissions intensity (tonnes/km²/year) | 768.8 tons/km² |
Recent Nearby Earthquakes
Magnitude 3.0 and greater
| Date▼ | Time↕ | Magnitude↕ | Distance↕ | Depth↕ | Location↕ | Link |
|---|---|---|---|---|---|---|
| 4/11/93 | 8:14 PM | 3.7 | 50.9 km | 10,000 m | Sweden | usgs.gov |
| 7/25/87 | 5:31 AM | 3 | 45.9 km | 10,000 m | Sweden | usgs.gov |
Source: U.S. Geological Survey (USGS)
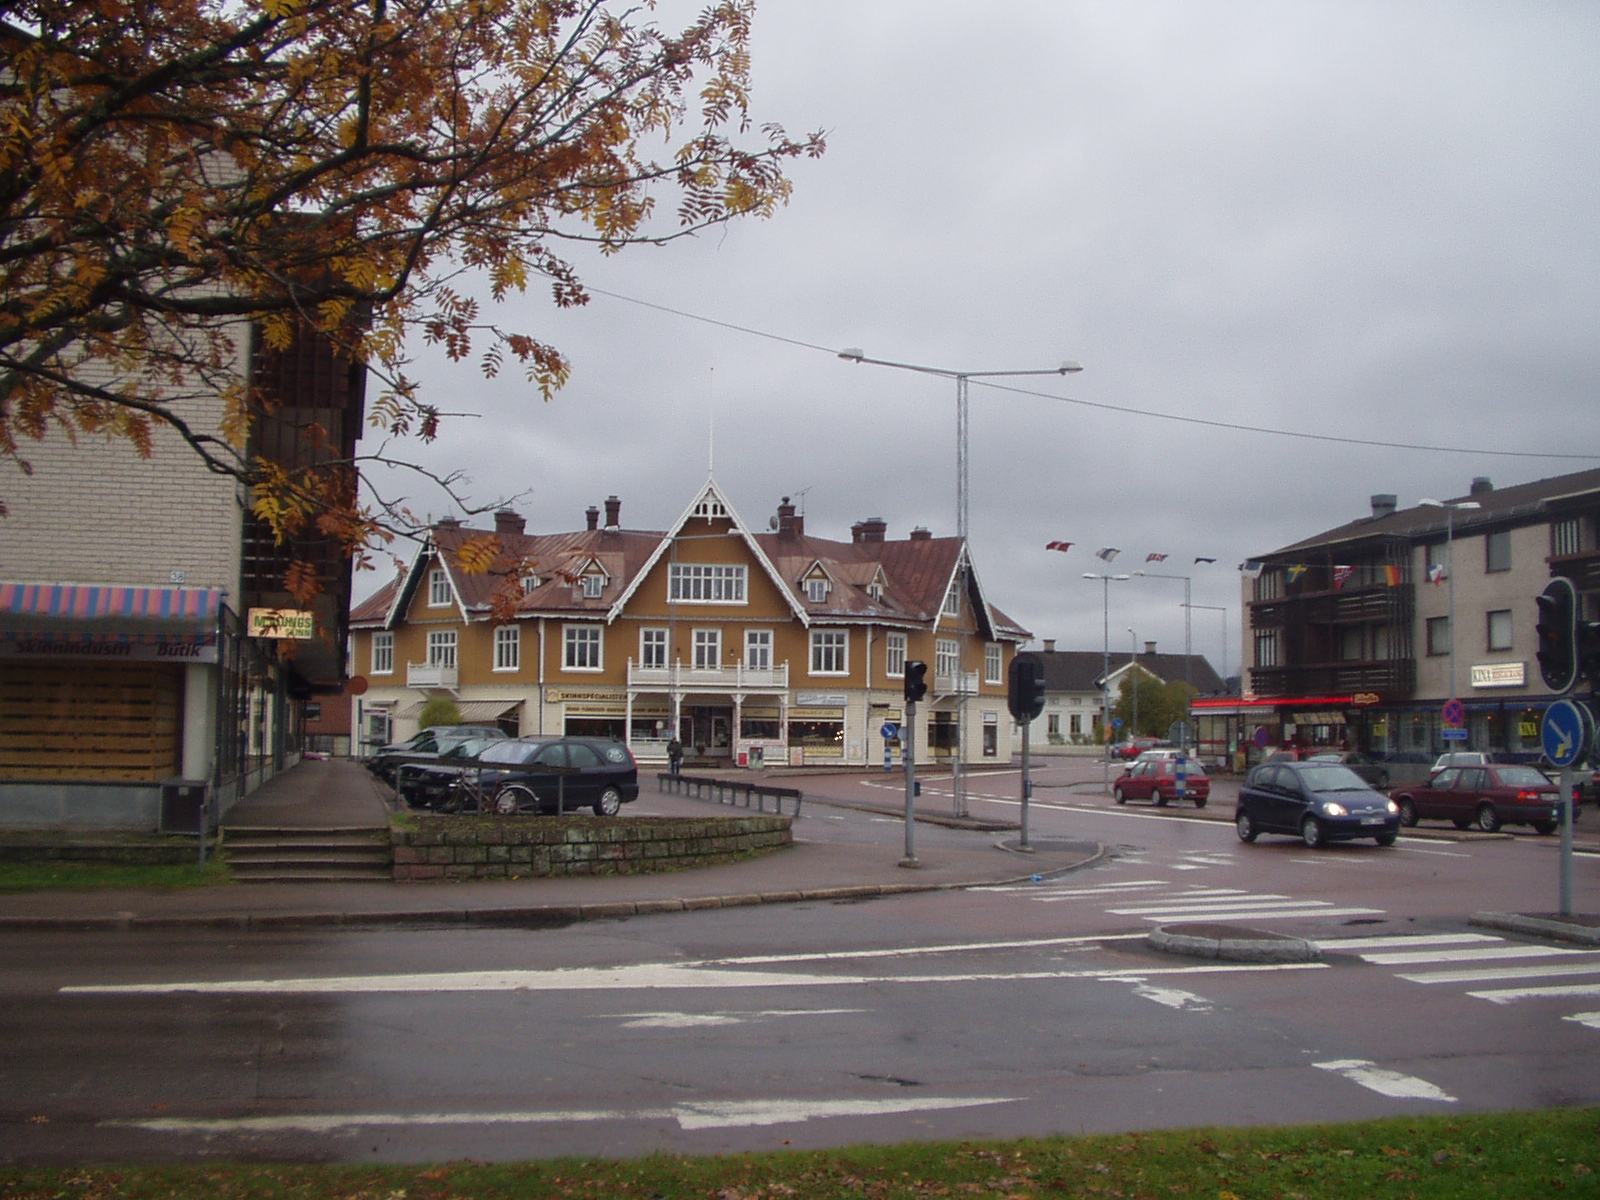
Nås
Nås is a locality situated in Vansbro Municipality, Dalarna County, Sweden with 417 inhabitants in 2010. was the birthplace of Lewis Larsson and provided inspiration for Selma Lagerlöf's novel Jerusalem.
Nås Wikipedia Page


About Our Data
The data on this page is estimated using a number of publicly available tools and resources. It is provided without warranty, and could contain inaccuracies. Use at your own risk.