Industries
Business Distribution by Industry in Varnhem
| Industry Description | Number of Establishments | Average Age of Business |
|---|---|---|
| Other membership organizations | 9 | 32 years |
Varnhem Facts
| Area | 1.4 km² |
| Population | 264 |
| Population change (1975 to 2020) | -65.7% |
| Population change (2000 to 2020) | -15.9% |
| Local Time | |
| Timezone | Central European Summer Time |
| Lat & Lng | 58.38333, 13.65000 |
| Postal Codes | 532 73 |
Map of Varnhem
Interactive Map
Varnhem Population
Years 1975 to 2020
| Data | 1975 | 1990 | 2000 | 2015 | 2020 |
|---|---|---|---|---|---|
| Population | 769 | 706 | 314 | 256 | 264 |
| Population Density | 535 / km² | 491.1 / km² | 218.4 / km² | 178.1 / km² | 183.7 / km² |
Varnhem Population change from 2000 to 2015
Decrease of 18.5% from year 2000 to 2015
| Location | Change since 1975 | Change since 1990 | Change since 2000 |
|---|---|---|---|
| Varnhem | -66.7% | -63.7% | -18.5% |
| Västra Götaland County | +15.2% | +11.1% | +8.1% |
| Sweden | +19.2% | +14.2% | +10.2% |
Varnhem Population Density
Population Density: 184 / km²
| Location | Population | Area | Density |
|---|---|---|---|
| Varnhem | 264 | 1.438 km² | 184 / km² |
| Västra Götaland County | 1.6 million | 34,528 km² | 47.1 / km² |
| Sweden | 9.6 million | 449,151.6 km² | 21.3 / km² |
Varnhem Historical and Projected Population
Estimated Population from 0 to 2100
- JRC (European Commission's Joint Research Centre) work on the GHS built-up grid
- CIESIN (Center for International Earth Science Information Network)
- [Link] Klein Goldewijk, K., Beusen, A., Doelman, J., and Stehfest, E.: Anthropogenic land use estimates for the Holocene – HYDE 3.2, Earth Syst. Sci. Data, 9, 927–953, https://doi.org/10.5194/essd-9-927-2017, 2017.
Area Codes
Percentage Area Codes used by businesses in Varnhem
Price Distribution
Business distribution by price for Varnhem
Human Development Index (HDI)
Statistic composite index of life expectancy, education, and per capita income.
Varnhem CO2 Emissions
Carbon Dioxide (CO2) Emissions Per Capita in Tonnes Per Year
| Location | CO2 Emissions | CO2 Emissions Per Capita | CO2 Emissions Intensity |
|---|---|---|---|
| Varnhem | 2,655 tn | 10.06 tn | 1,847.2 tons/km² |
| Västra Götaland County | 13,696,504 tn | 8.41 tn | 396.7 tons/km² |
| Sweden | 93,354,240 tn | 9.75 tn | 207.8 tons/km² |
| 2013 CO2 emissions (tonnes/year) | 2,655 tn |
| 2013 CO2 emissions (tonnes/year) per capita | 10.06 tn |
| 2013 CO2 emissions intensity (tonnes/km²/year) | 1,847.2 tons/km² |
Recent Nearby Earthquakes
Magnitude 3.0 and greater
| Date▼ | Time↕ | Magnitude↕ | Distance↕ | Depth↕ | Location↕ | Link |
|---|---|---|---|---|---|---|
| 2/1/95 | 9:33 PM | 3.4 | 34.4 km | 10,000 m | Sweden | usgs.gov |
| 11/2/86 | 7:47 AM | 3.6 | 47.9 km | 10,000 m | Sweden | usgs.gov |
| 7/14/86 | 2:45 PM | 3.4 | 17.5 km | 10,000 m | Sweden | usgs.gov |
| 7/14/86 | 1:50 PM | 4.8 | 10 km | 10,000 m | Sweden | usgs.gov |
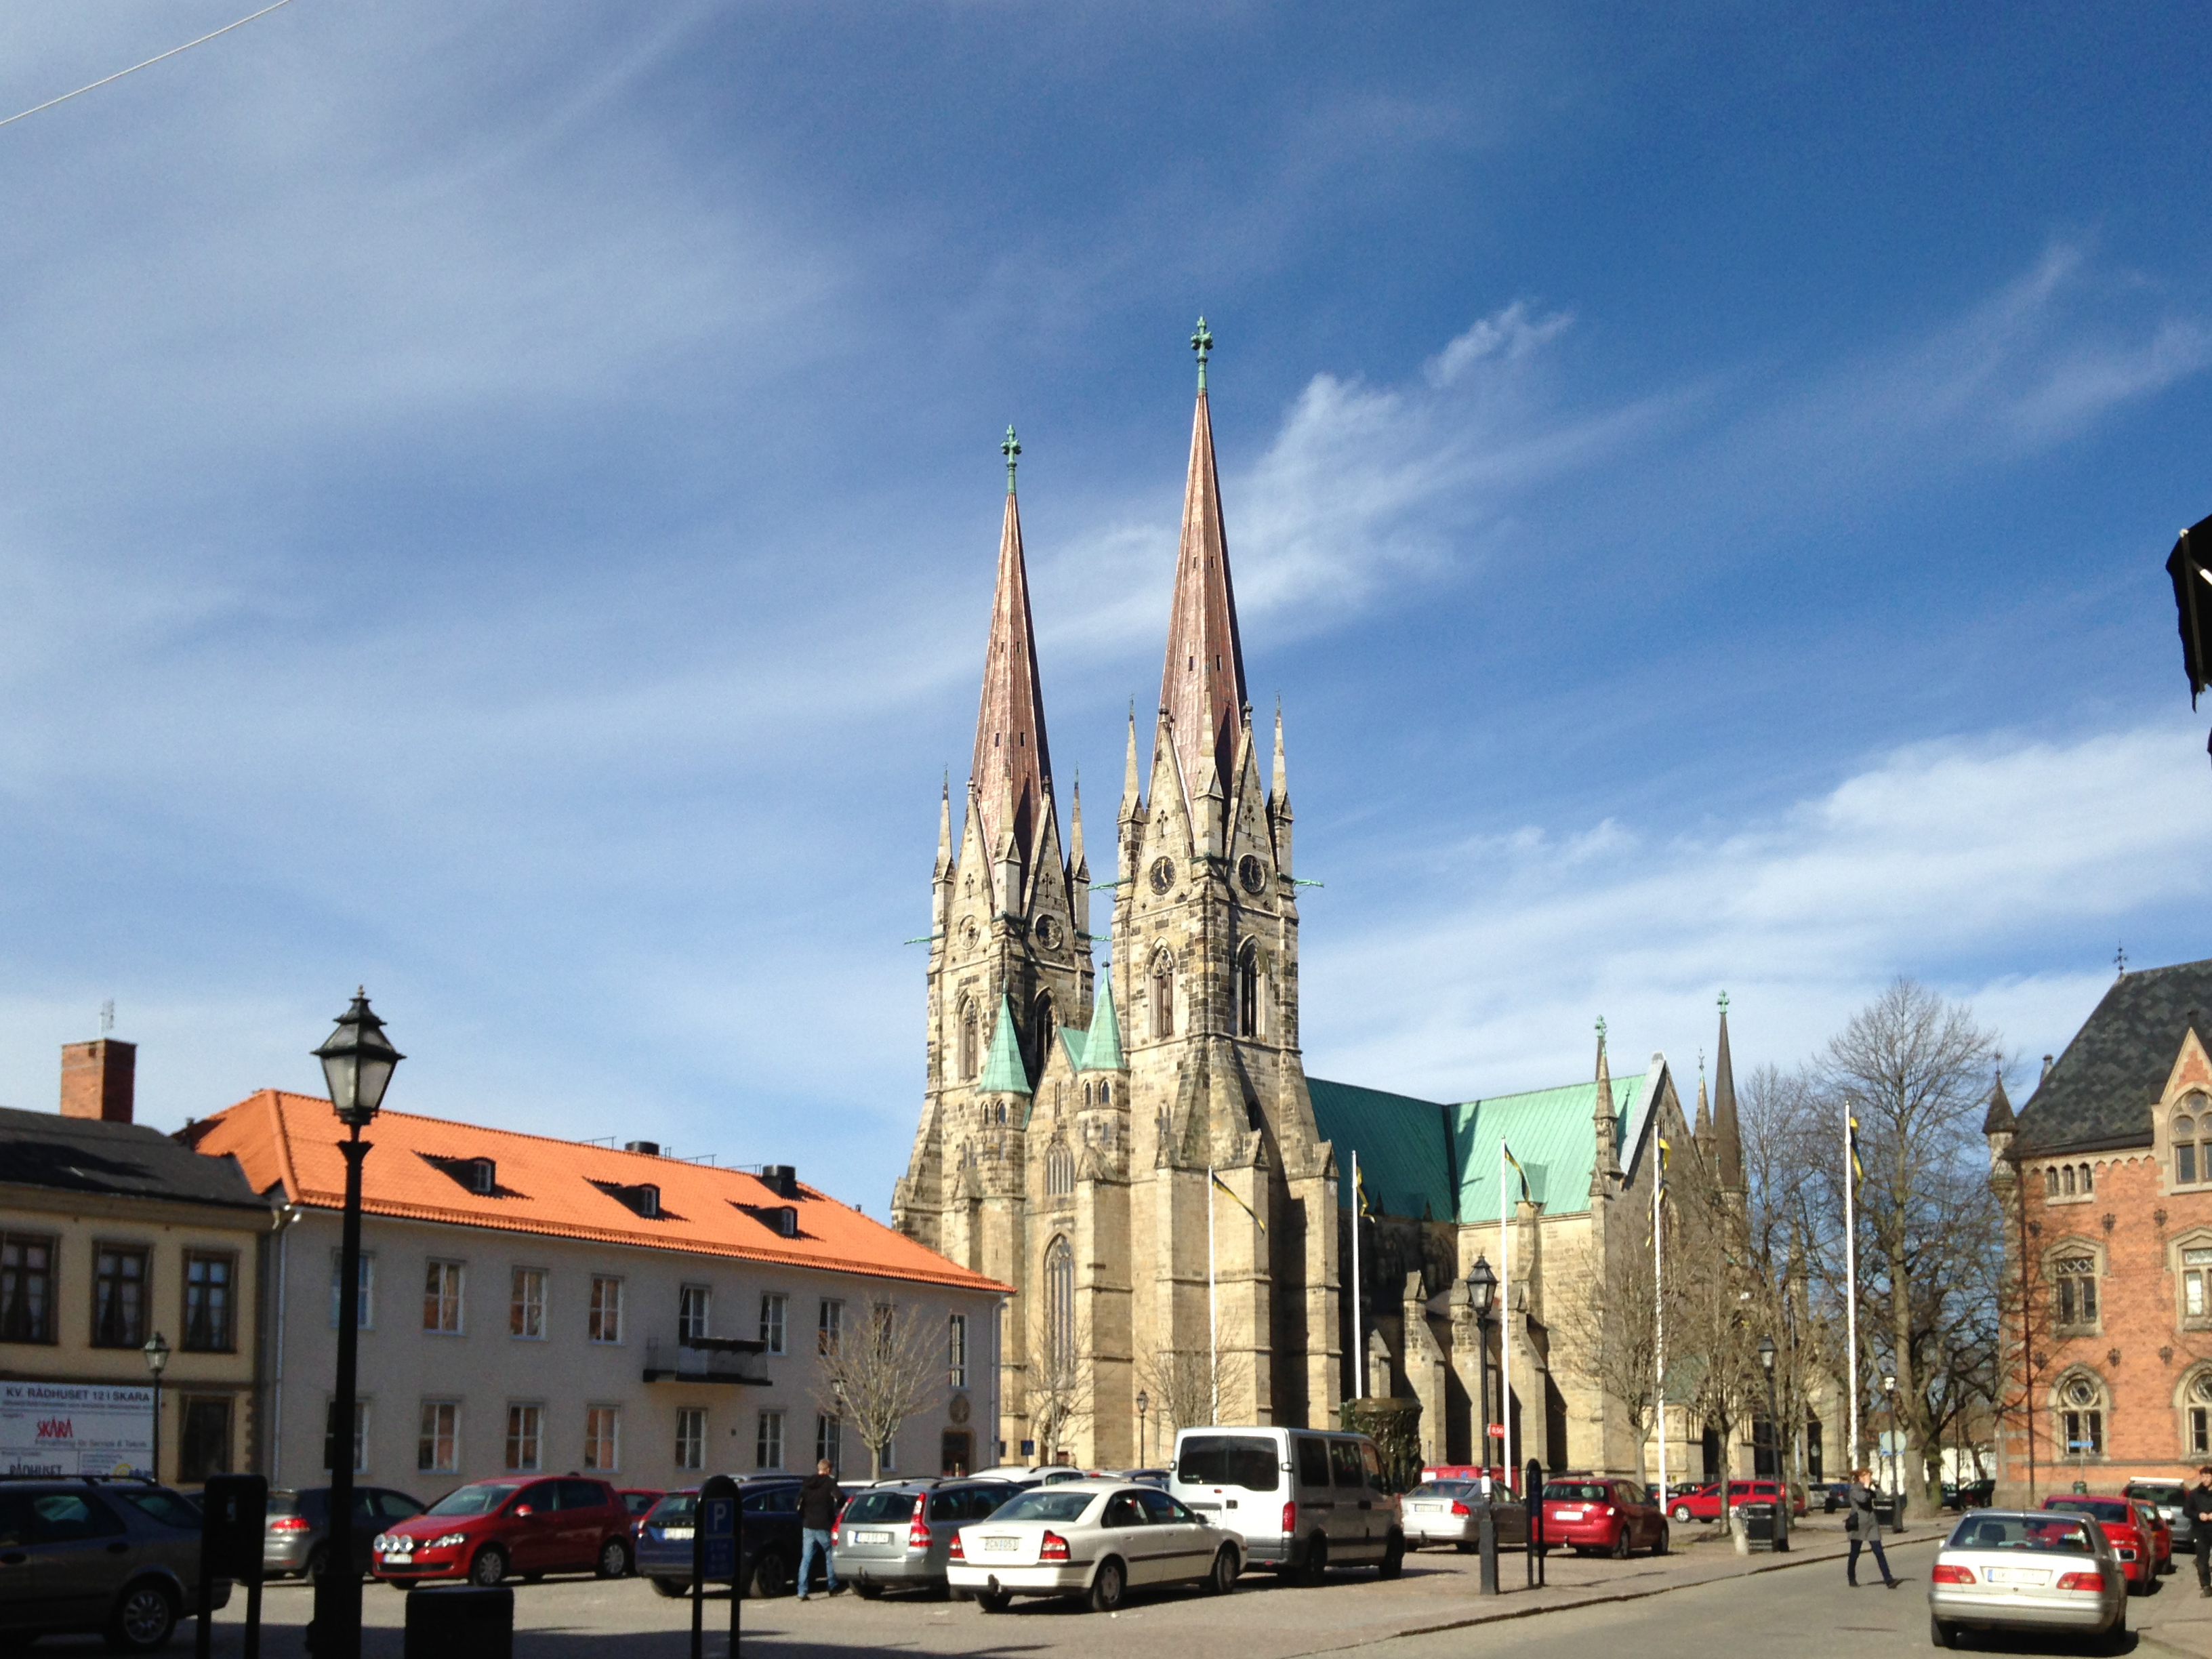
Varnhem
Varnhem is a locality situated in Skara Municipality, Västra Götaland County, Sweden with 707 inhabitants in 2010. is the location of the oldest known stone church in Sweden outside of Scania, erected in the 1040s at the latest. It is also the locat..
Varnhem Wikipedia Page


About Our Data
The data on this page is estimated using a number of publicly available tools and resources. It is provided without warranty, and could contain inaccuracies. Use at your own risk.