Categories in Visby
Industries
Business Distribution by Industry in Visby
| Industry Description | Number of Establishments | Average Age of Business |
|---|---|---|
| Other membership organizations | 452 | 31 years |
| Restaurants | 396 | 25 years |
| Real estate | 333 | 30 years |
| Shopping other | 315 | 30 years |
| Construction of buildings | 285 | 27 years |
| Shopping | 248 | 31 years |
| Corporate management | 247 | 23 years |
| Beauty salons | 163 | 24 years |
| Unreachable | 162 | 27 years |
| Wholesale of machinery | 148 | 29 years |
| Electronics stores | 134 | 26 years |
| Buses and trains | 120 | — |
| Technical construction services | 115 | 27 years |
| Hairdressers | 110 | 26 years |
Visby Facts
| Area | 18.6 km² |
| Population | 21,932 |
| Male Population | 10,435 (47.6%) |
| Female Population | 11,497 (52.4%) |
| Population change (1975 to 2020) | -12.5% |
| Population change (2000 to 2020) | -1.4% |
| Median Age | 44.9 years (Male: 43.6, Female: 46.1) |
| Neighborhoods | Barlingbo, Gamla Visby, Nyhamn, Innerstaden, Centrum, Visby |
| Local Time | |
| Timezone | Central European Summer Time |
| Lat & Lng | 57.64089, 18.29602 |
| Postal Codes | 621 00, 621 05, 621 11, 621 12, 621 13, More |
Map of Visby
Interactive Map
Visby Population
Years 1975 to 2020
| Data | 1975 | 1990 | 2000 | 2015 | 2020 |
|---|---|---|---|---|---|
| Population | 25,076 | 23,368 | 22,250 | 21,040 | 21,932 |
| Population Density | 1,350.9 / km² | 1,258.9 / km² | 1,198.7 / km² | 1,133.5 / km² | 1,181.5 / km² |
Visby Population change from 2000 to 2015
Decrease of 5.4% from year 2000 to 2015
| Location | Change since 1975 | Change since 1990 | Change since 2000 |
|---|---|---|---|
| Visby | -16.1% | -10% | -5.4% |
| Gotland County | -13.3% | -7.6% | -3.5% |
| Sweden | +19.2% | +14.2% | +10.2% |
Visby Median Age
Median Age: 44.9 years
| Location | Median Age | Median Age (Female) | Median Age (Male) |
|---|---|---|---|
| Visby | 44.9 yrs | 46.1 yrs | 43.6 yrs |
| Gotland County | 44.9 yrs | 46.1 yrs | 43.6 yrs |
| Sweden | 40.8 yrs | 41.8 yrs | 39.8 yrs |
Visby Population Density
Population Density: 1,182 / km²
| Location | Population | Area | Density |
|---|---|---|---|
| Visby | 21,932 | 18.6 km² | 1,182 / km² |
| Gotland County | 56,813 | 15,318.4 km² | 3.7 / km² |
| Sweden | 9.6 million | 449,151.6 km² | 21.3 / km² |
Visby Historical and Projected Population
Estimated Population from 1300 to 2100
- JRC (European Commission's Joint Research Centre) work on the GHS built-up grid
- CIESIN (Center for International Earth Science Information Network)
- [Link] Klein Goldewijk, K., Beusen, A., Doelman, J., and Stehfest, E.: Anthropogenic land use estimates for the Holocene – HYDE 3.2, Earth Syst. Sci. Data, 9, 927–953, https://doi.org/10.5194/essd-9-927-2017, 2017.
Area Codes
Percentage Area Codes used by businesses in Visby
Postal Codes
Percentage of businesses by Postal Codes in Visby
Price Distribution
Business distribution by price for Visby
Human Development Index (HDI)
Statistic composite index of life expectancy, education, and per capita income.
Visby CO2 Emissions
Carbon Dioxide (CO2) Emissions Per Capita in Tonnes Per Year
| Location | CO2 Emissions | CO2 Emissions Per Capita | CO2 Emissions Intensity |
|---|---|---|---|
| Visby | 198,522 tn | 9.05 tn | 10,694.8 tons/km² |
| Gotland County | 110,477 tn | 1.94 tn | 7.2 tons/km² |
| Sweden | 93,354,240 tn | 9.75 tn | 207.8 tons/km² |
| 2013 CO2 emissions (tonnes/year) | 198,522 tn |
| 2013 CO2 emissions (tonnes/year) per capita | 9.05 tn |
| 2013 CO2 emissions intensity (tonnes/km²/year) | 10,694.8 tons/km² |
Recent Nearby Earthquakes
Magnitude 3.0 and greater
| Date▼ | Time↕ | Magnitude↕ | Distance↕ | Depth↕ | Location↕ | Link |
|---|---|---|---|---|---|---|
| 9/29/04 | 11:15 PM | 3.7 | 76.2 km | 10,000 m | Baltic Sea | usgs.gov |
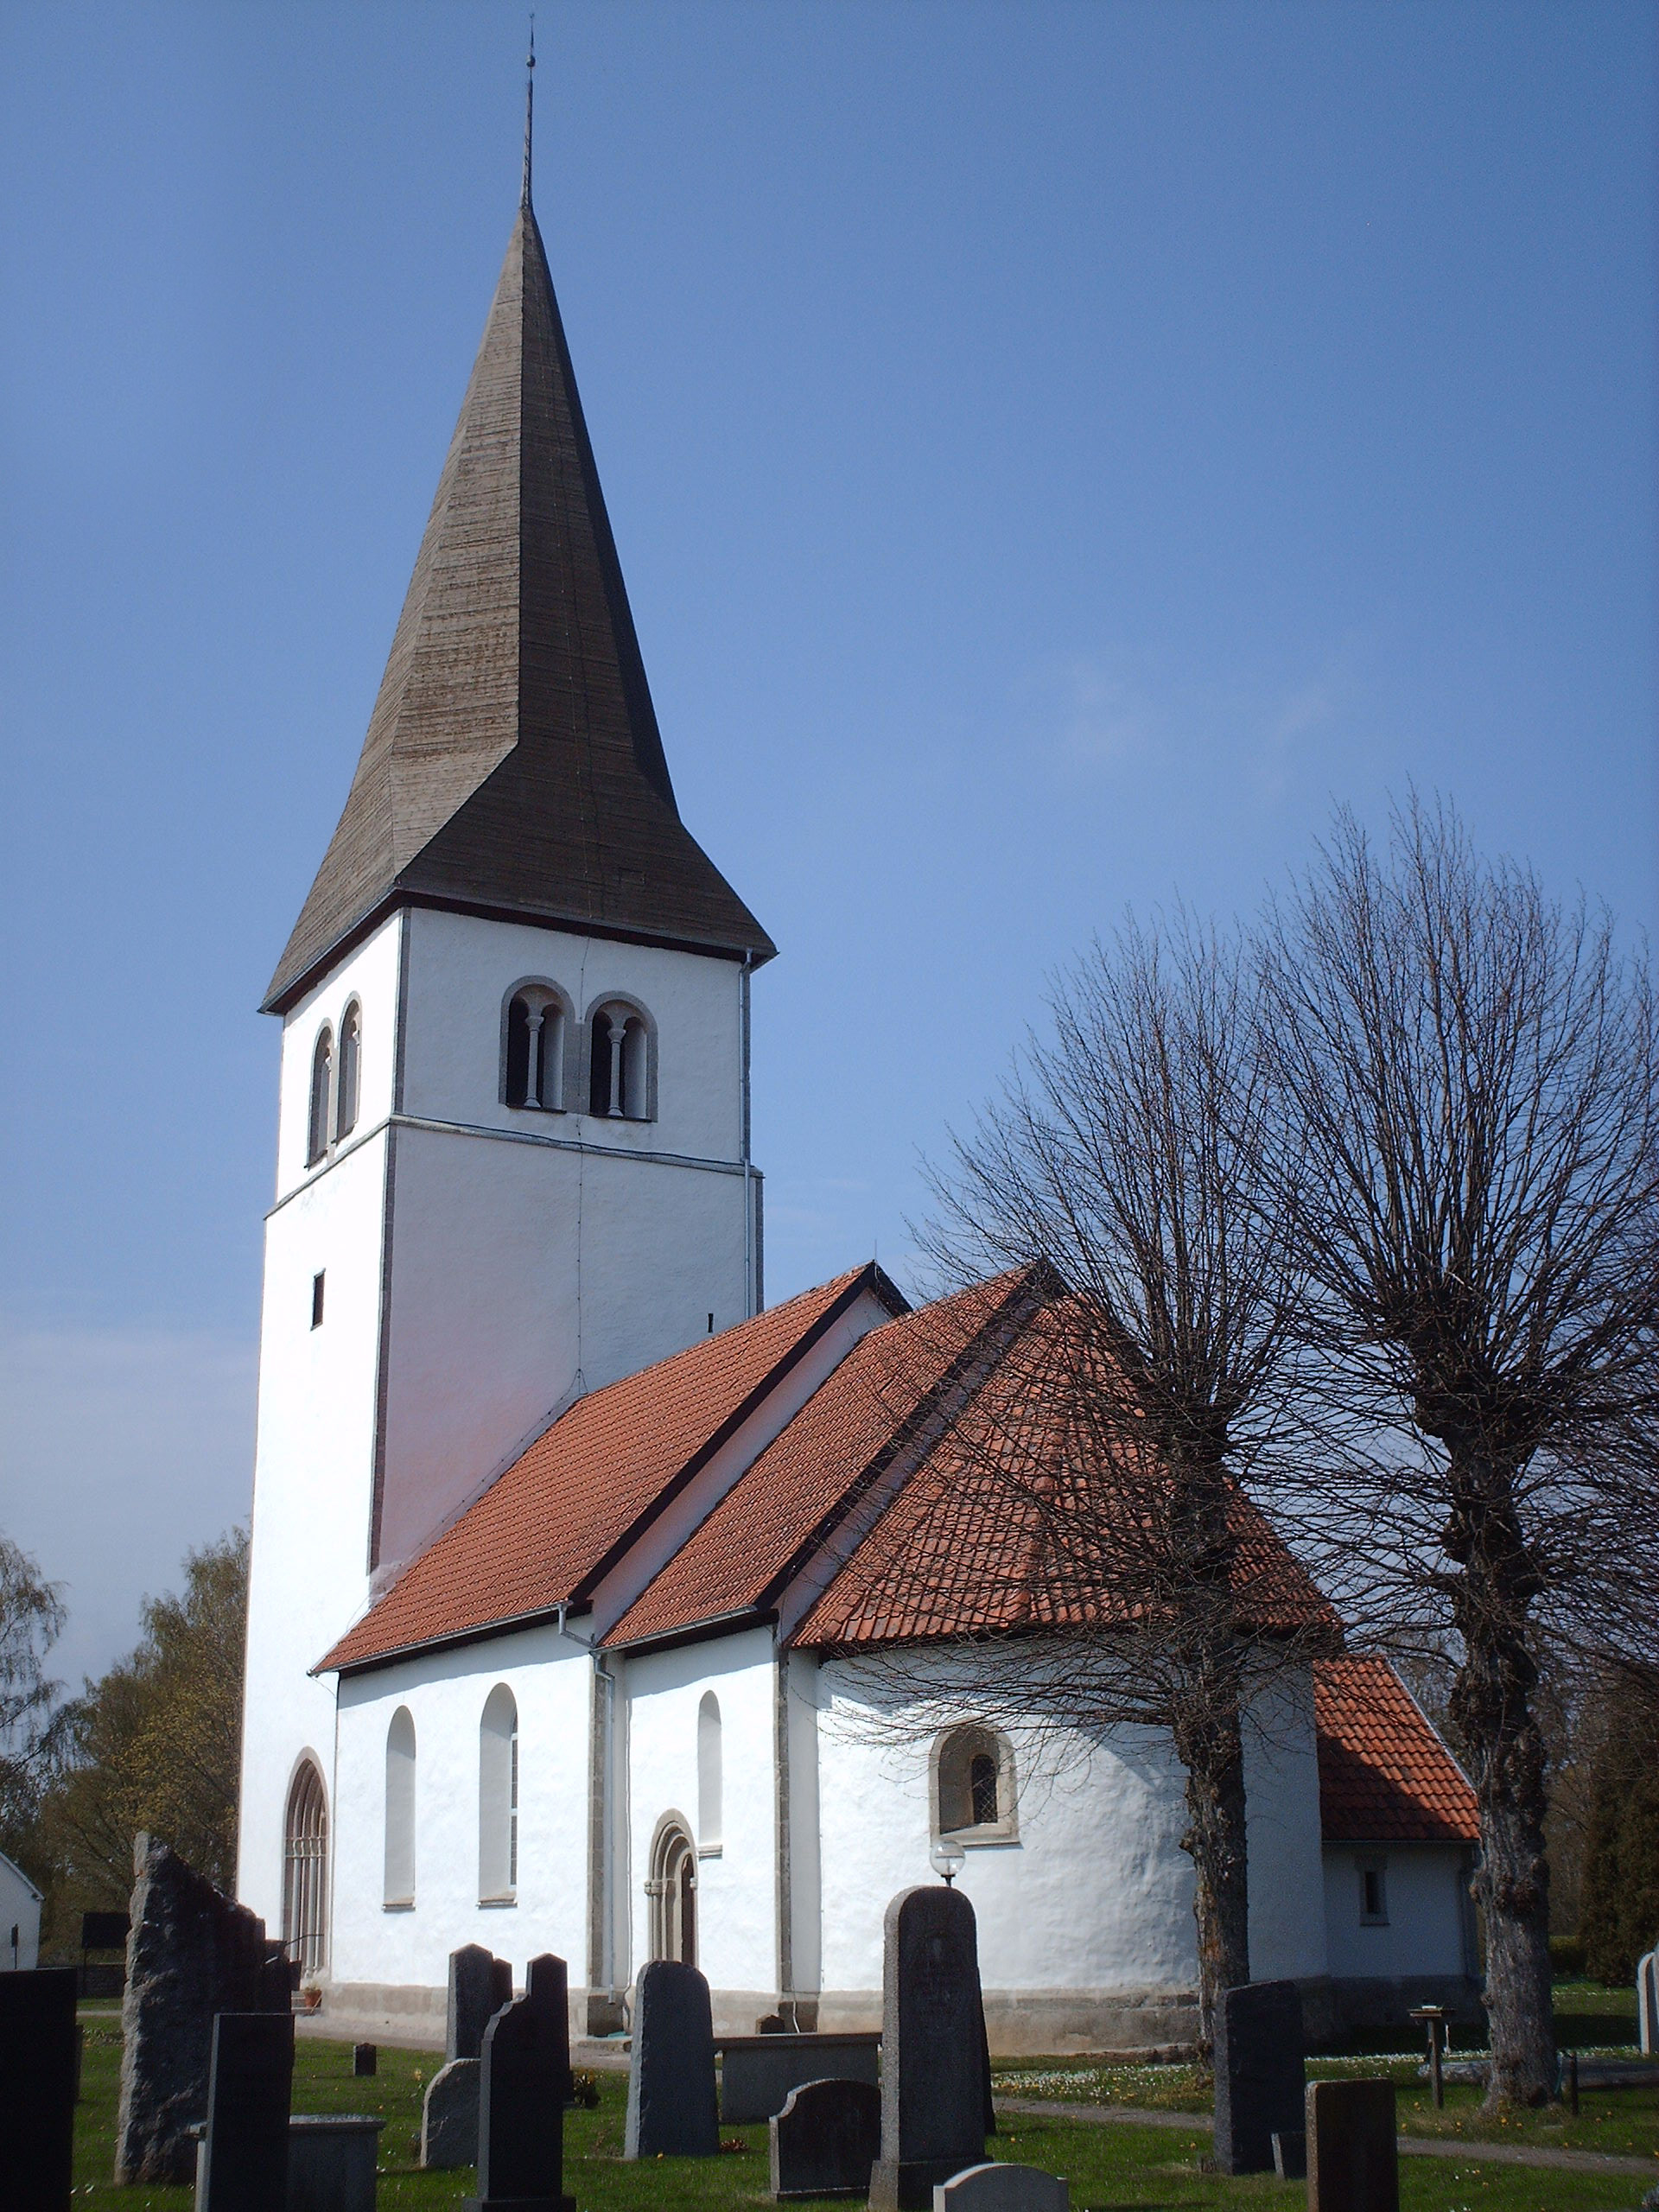
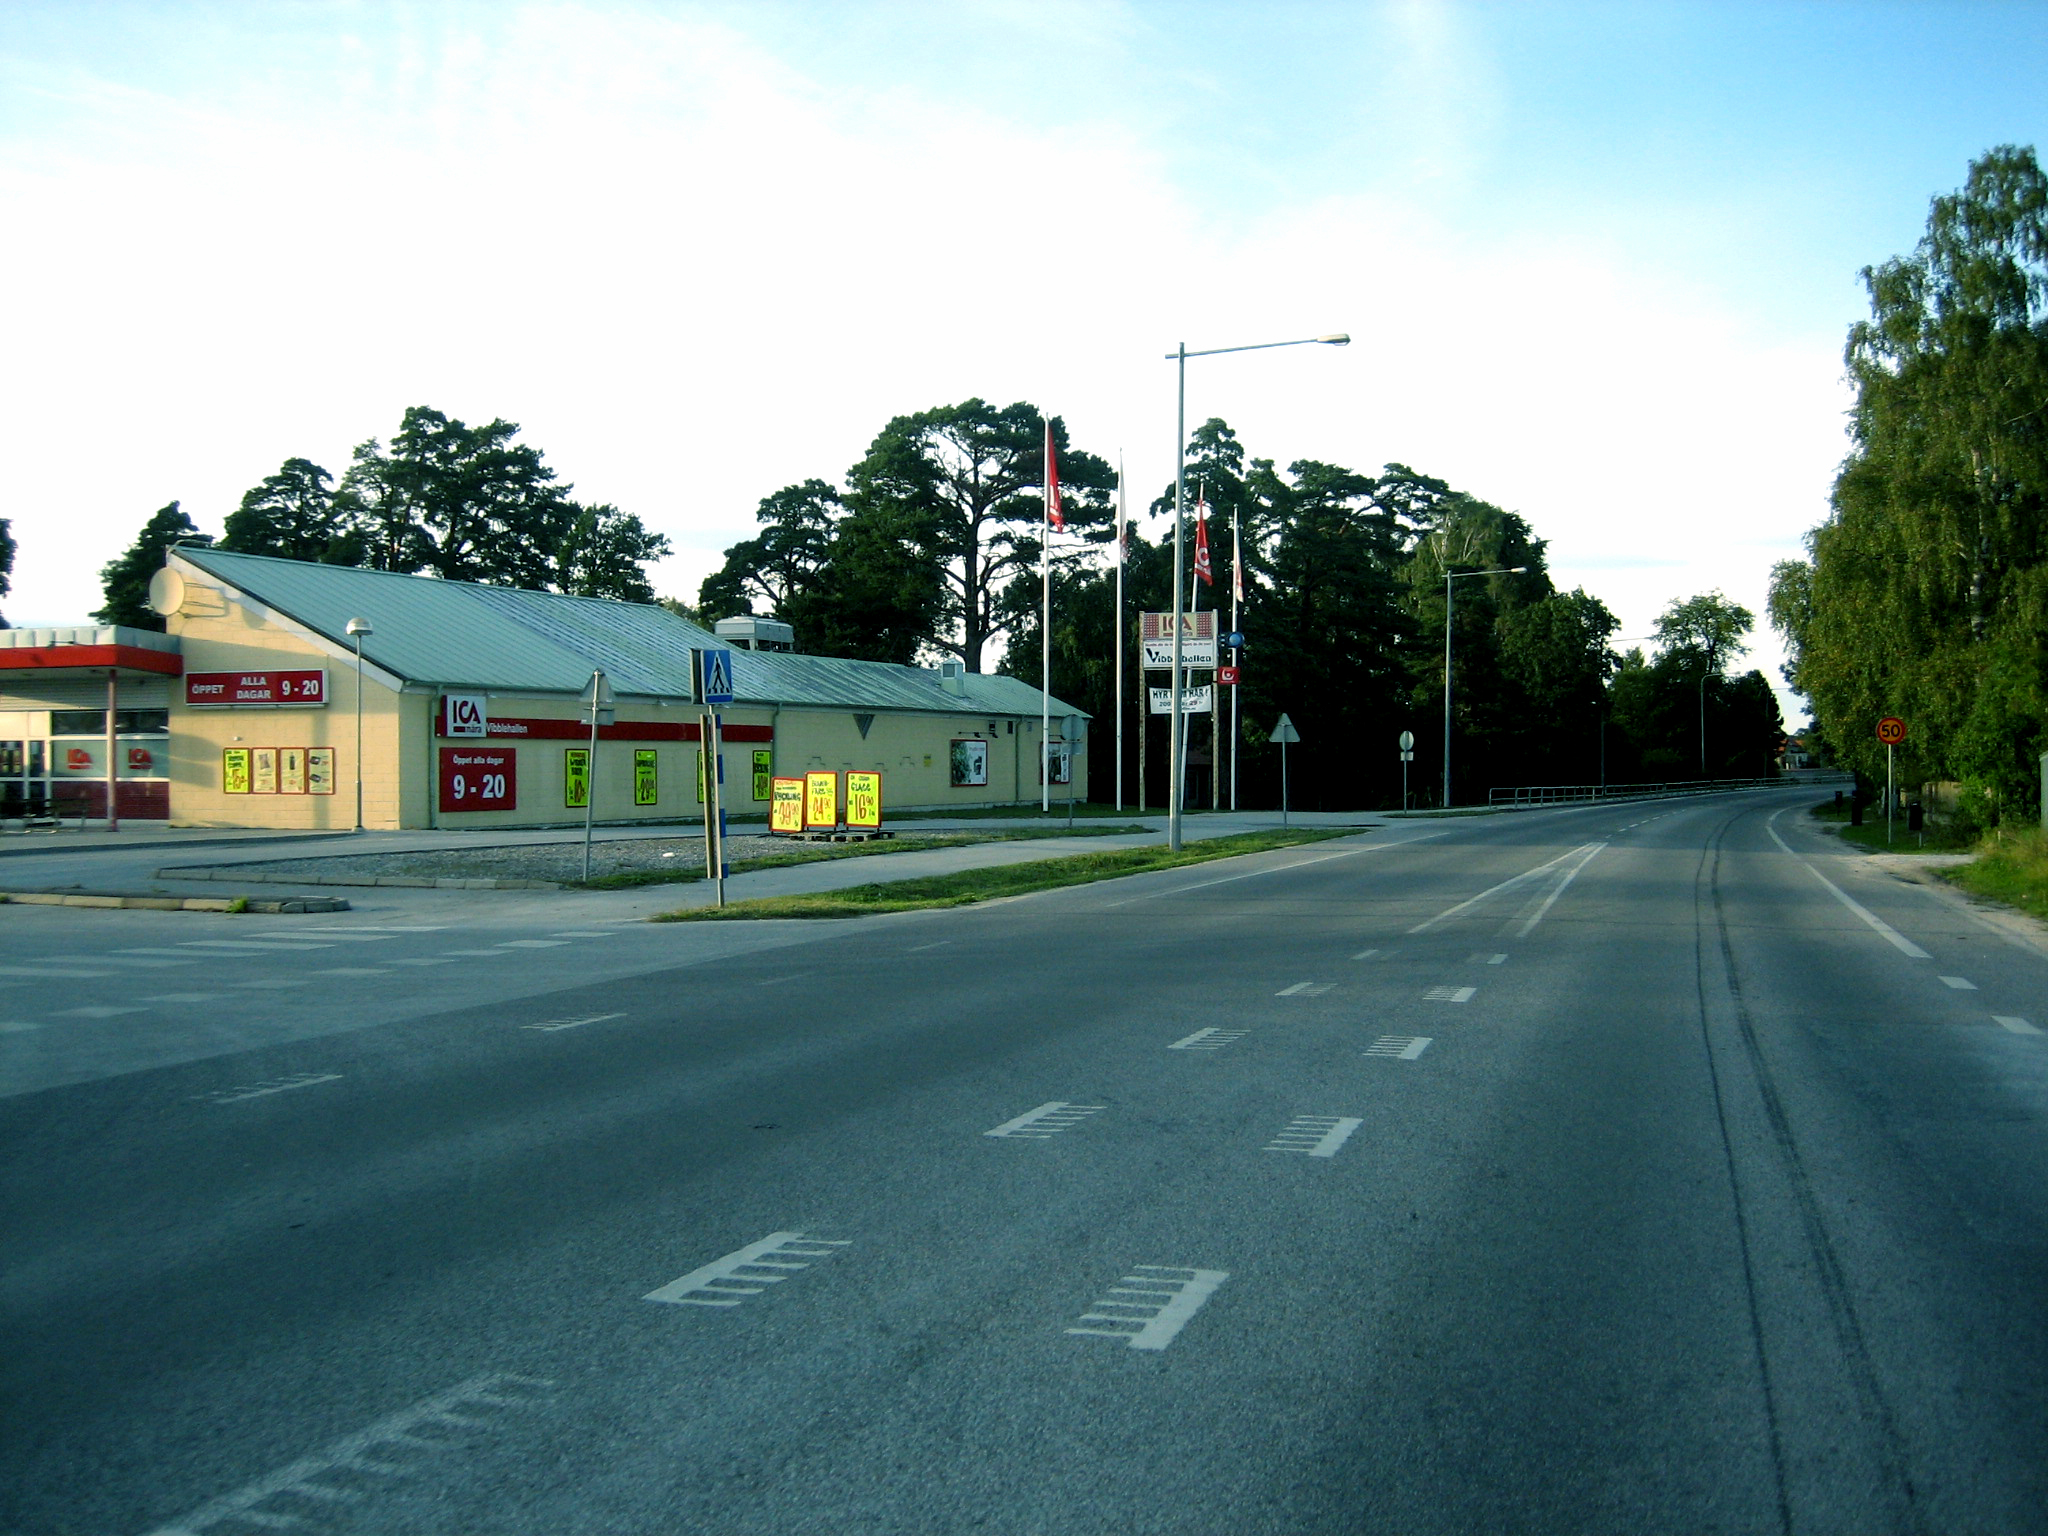
Visby
Visby [ˈviːspʏ] is a locality and the seat of Gotland Municipality in Gotland County, Sweden with 23,576 inhabitants, as of 2012. Visby is also the episcopal see for the Diocese of Visby. It is the only locality with historical city status on the isl..
Visby Wikipedia Page

About Our Data
The data on this page is estimated using a number of publicly available tools and resources. It is provided without warranty, and could contain inaccuracies. Use at your own risk.