Categories in Hat Yai
Industries
Business Distribution by Industry in Hat Yai
| Industry Description | Number of Establishments | Average Age of Business |
|---|---|---|
| Restaurants | 4,673 | 21 years |
| Shopping | 1,913 | 26 years |
| Cafes | 1,158 | — |
| Other accommodation | 1,058 | 21 years |
| Car repair | 716 | 23 years |
| Corporate management | 688 | 25 years |
| Grocery stores and supermarkets | 656 | — |
| Beauty salons | 561 | — |
| Education | 496 | — |
| Electronics stores | 474 | 28 years |
| Clothing stores | 466 | — |
Hat Yai Facts
| Area | 215.4 km² |
| Population | 386,197 |
| Male Population | 188,427 (48.8%) |
| Female Population | 197,770 (51.2%) |
| Population change (1975 to 2020) | +153.9% |
| Population change (2000 to 2020) | +22.4% |
| Median Age | 32.5 years (Male: 31.7, Female: 33.2) |
| Area Codes | 74 |
| Neighborhoods | Tambon Hat Yai, Tambon Kho Hong, อำเภอเมืองหาดใหญ่, Tambon Khuan Lang, หาดใหญ่ |
| Local Time | |
| Timezone | Indochina Time |
| Lat & Lng | 7.00836, 100.47668 |
| Postal Codes | 90110, 90250 |
Map of Hat Yai
Interactive Map
Hat Yai Population
Years 1975 to 2020
| Data | 1975 | 1990 | 2000 | 2015 | 2020 |
|---|---|---|---|---|---|
| Population | 152,085 | 256,907 | 315,585 | 372,230 | 386,197 |
| Population Density | 705.9 / km² | 1,192.5 / km² | 1,464.9 / km² | 1,727.8 / km² | 1,792.6 / km² |
Hat Yai Population change from 2000 to 2015
Increase of 17.9% from year 2000 to 2015
| Location | Change since 1975 | Change since 1990 | Change since 2000 |
|---|---|---|---|
| Hat Yai | +144.8% | +44.9% | +17.9% |
| Songkhla Province | +209.9% | +83.1% | +42.5% |
| Thailand | +60.4% | +20.1% | +8.3% |
Hat Yai Median Age
Median Age: 32.5 years
| Location | Median Age | Median Age (Female) | Median Age (Male) |
|---|---|---|---|
| Hat Yai | 32.5 yrs | 33.2 yrs | 31.7 yrs |
| Songkhla Province | 32.5 yrs | 33.2 yrs | 31.7 yrs |
| Thailand | 35.2 yrs | 36 yrs | 34.3 yrs |
Hat Yai Population Density
Population Density: 1,793 / km²
| Location | Population | Area | Density |
|---|---|---|---|
| Hat Yai | 386,197 | 215.4 km² | 1,793 / km² |
| Songkhla Province | 5,300 | 21.5 km² | 247 / km² |
| Thailand | 67.6 million | 514,961.7 km² | 131 / km² |
Hat Yai Historical and Projected Population
Estimated Population from 1860 to 2100
- JRC (European Commission's Joint Research Centre) work on the GHS built-up grid
- CIESIN (Center for International Earth Science Information Network)
- [Link] Klein Goldewijk, K., Beusen, A., Doelman, J., and Stehfest, E.: Anthropogenic land use estimates for the Holocene – HYDE 3.2, Earth Syst. Sci. Data, 9, 927–953, https://doi.org/10.5194/essd-9-927-2017, 2017.
Neighborhoods in Hat Yai
Percentage of businesses by neighborhood in Hat Yai
Area Codes
Percentage Area Codes used by businesses in Hat Yai
Price Distribution
Business distribution by price for Hat Yai
Human Development Index (HDI)
Statistic composite index of life expectancy, education, and per capita income.
Hat Yai CO2 Emissions
Carbon Dioxide (CO2) Emissions Per Capita in Tonnes Per Year
| Location | CO2 Emissions | CO2 Emissions Per Capita | CO2 Emissions Intensity |
|---|---|---|---|
| Hat Yai | 1,967,167 tn | 5.09 tn | 9,131 tons/km² |
| Songkhla Province | 26,543 tn | 5.01 tn | 1,235 tons/km² |
| Thailand | 278,589,420 tn | 4.12 tn | 541 tons/km² |
| 2013 CO2 emissions (tonnes/year) | 1,967,167 tn |
| 2013 CO2 emissions (tonnes/year) per capita | 5.09 tn |
| 2013 CO2 emissions intensity (tonnes/km²/year) | 9,131 tons/km² |
Natural Hazards Risk
Relative risk out of 10
| Hazard | Risk Level |
|---|---|
| Flood | High (10) |
| Earthquake | Low (2) |
* Risk, particularly concerning flood or landslide, may not be for the entire area.
- Dilley, M., R.S. Chen, U. Deichmann, A.L. Lerner-Lam, M. Arnold, J. Agwe, P. Buys, O. Kjekstad, B. Lyon, and G. Yetman. 2005. Natural Disaster Hotspots: A Global Risk Analysis. Washington, D.C.: World Bank. https://doi.org/10.1596/0-8213-5930-4.
- Center for Hazards and Risk Research - CHRR - Columbia University, Center for International Earth Science Information Network - CIESIN - Columbia University. 2005. Global Flood Hazard Frequency and Distribution. Palisades, NY: NASA Socioeconomic Data and Applications Center (SEDAC). https://doi.org/10.7927/H4668B3D.
- Center for Hazards and Risk Research - CHRR - Columbia University, Center for International Earth Science Information Network - CIESIN - Columbia University. 2005. Global Earthquake Hazard Distribution - Peak Ground Acceleration. Palisades, NY: NASA Socioeconomic Data and Applications Center (SEDAC). https://doi.org/10.7927/H4BZ63ZS.
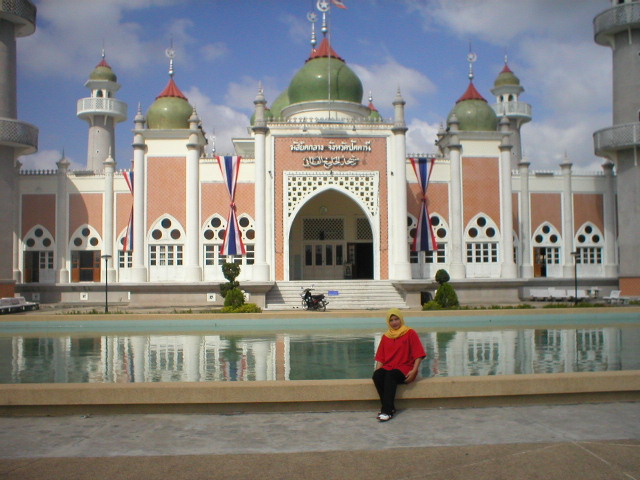
Hat Yai
Hat Yai (Thai: หาดใหญ่, pronounced [hàːt jàj], also Haad Yai or Had Yai) is a city in southern Thailand near the Malaysian border. Located at 7°1′N 100°28′E, it is 946 km (588 mi) south of Bangkok, and has a population of 158,218 (2012) in the city i..
Hat Yai Wikipedia Page

About Our Data
The data on this page is estimated using a number of publicly available tools and resources. It is provided without warranty, and could contain inaccuracies. Use at your own risk.