Categories in Hergla
Industries
Business Distribution by Industry in Hergla
| Industry Description | Number of Establishments |
|---|---|
| Restaurants | 24 |
| Apartments | 23 |
| Other accommodation | 17 |
| Cafes | 17 |
| Corporate management | 6 |
| Holiday homes, cabins and resorts | 6 |
| Shopping | 6 |
| Education | 5 |
| Travel agencies | 5 |
Hergla Facts
| Area | 95.8 km² |
| Population | 9,210 |
| Male Population | 4,653 (50.5%) |
| Female Population | 4,557 (49.5%) |
| Population change (1975 to 2020) | +196.0% |
| Population change (2000 to 2020) | +34.8% |
| Median Age | 29.4 years (Male: 28.8, Female: 29.9) |
| Local Time | |
| Timezone | Central European Standard Time |
| Lat & Lng | 36.03027, 10.50904 |
| Postal Codes | 4012 |
Map of Hergla
Interactive Map
Hergla Population
Years 1975 to 2020
| Data | 1975 | 1990 | 2000 | 2015 | 2020 |
|---|---|---|---|---|---|
| Population | 3,112 | 5,211 | 6,831 | 8,825 | 9,210 |
| Population Density | 32.5 / km² | 54.4 / km² | 71.3 / km² | 92.2 / km² | 96.2 / km² |
Hergla Population change from 2000 to 2015
Increase of 29.2% from year 2000 to 2015
| Location | Change since 1975 | Change since 1990 | Change since 2000 |
|---|---|---|---|
| Hergla | +183.6% | +69.4% | +29.2% |
| Sousse Governorate | +207.2% | +81.8% | +37.3% |
| Tunisia | +99.1% | +36.8% | +16% |
Hergla Median Age
Median Age: 29.4 years
| Location | Median Age | Median Age (Female) | Median Age (Male) |
|---|---|---|---|
| Hergla | 29.4 yrs | 29.9 yrs | 28.8 yrs |
| Sousse Governorate | 29.3 yrs | 29.8 yrs | 28.7 yrs |
| Tunisia | 30.5 yrs | 30.9 yrs | 30.1 yrs |
Hergla Population Density
Population Density: 96.2 / km²
| Location | Population | Area | Density |
|---|---|---|---|
| Hergla | 9,210 | 95.8 km² | 96.2 / km² |
| Sousse Governorate | 702,408 | 2,668.5 km² | 263 / km² |
| Tunisia | 11.2 million | 155,342.3 km² | 71.9 / km² |
Hergla Historical and Projected Population
Estimated Population from 0 to 2100
- JRC (European Commission's Joint Research Centre) work on the GHS built-up grid
- CIESIN (Center for International Earth Science Information Network)
- [Link] Klein Goldewijk, K., Beusen, A., Doelman, J., and Stehfest, E.: Anthropogenic land use estimates for the Holocene – HYDE 3.2, Earth Syst. Sci. Data, 9, 927–953, https://doi.org/10.5194/essd-9-927-2017, 2017.
Area Codes
Percentage Area Codes used by businesses in Hergla
Price Distribution
Business distribution by price for Hergla
Human Development Index (HDI)
Statistic composite index of life expectancy, education, and per capita income.
Hergla CO2 Emissions
Carbon Dioxide (CO2) Emissions Per Capita in Tonnes Per Year
| Location | CO2 Emissions | CO2 Emissions Per Capita | CO2 Emissions Intensity |
|---|---|---|---|
| Hergla | 25,869 tn | 2.81 tn | 270.2 tons/km² |
| Sousse Governorate | 2,225,651 tn | 3.17 tn | 834.1 tons/km² |
| Tunisia | 28,300,683 tn | 2.54 tn | 182.2 tons/km² |
| 2013 CO2 emissions (tonnes/year) | 25,869 tn |
| 2013 CO2 emissions (tonnes/year) per capita | 2.81 tn |
| 2013 CO2 emissions intensity (tonnes/km²/year) | 270.2 tons/km² |
Natural Hazards Risk
Relative risk out of 10
| Hazard | Risk Level |
|---|---|
| Drought | Medium (5) |
| Flood | Medium (4) |
| Earthquake | Medium (4.4) |
* Risk, particularly concerning flood or landslide, may not be for the entire area.
- Dilley, M., R.S. Chen, U. Deichmann, A.L. Lerner-Lam, M. Arnold, J. Agwe, P. Buys, O. Kjekstad, B. Lyon, and G. Yetman. 2005. Natural Disaster Hotspots: A Global Risk Analysis. Washington, D.C.: World Bank. https://doi.org/10.1596/0-8213-5930-4.
- Center for Hazards and Risk Research - CHRR - Columbia University, Center for International Earth Science Information Network - CIESIN - Columbia University, and International Research Institute for Climate and Society - IRI - Columbia University. 2005. Global Drought Hazard Frequency and Distribution. Palisades, NY: NASA Socioeconomic Data and Applications Center (SEDAC). https://doi.org/10.7927/H4VX0DFT.
- Center for Hazards and Risk Research - CHRR - Columbia University, Center for International Earth Science Information Network - CIESIN - Columbia University. 2005. Global Flood Hazard Frequency and Distribution. Palisades, NY: NASA Socioeconomic Data and Applications Center (SEDAC). https://doi.org/10.7927/H4668B3D.
- Center for Hazards and Risk Research - CHRR - Columbia University, Center for International Earth Science Information Network - CIESIN - Columbia University. 2005. Global Earthquake Hazard Distribution - Peak Ground Acceleration. Palisades, NY: NASA Socioeconomic Data and Applications Center (SEDAC). https://doi.org/10.7927/H4BZ63ZS.
Recent Nearby Earthquakes
Magnitude 3.0 and greater
| Date▼ | Time↕ | Magnitude↕ | Distance↕ | Depth↕ | Location↕ | Link |
|---|---|---|---|---|---|---|
| 6/2/16 | 10:49 AM | 4 | 82.2 km | 16,000 m | 22km SE of Menzel Heurr, Tunisia | usgs.gov |
| 10/21/13 | 7:37 PM | 4.4 | 66.2 km | 12,740 m | 3km ESE of Al Baqalitah, Tunisia | usgs.gov |
| 10/18/13 | 3:08 PM | 4.4 | 54.4 km | 20,200 m | 6km ENE of As Sayyadah, Tunisia | usgs.gov |
| 3/25/13 | 10:08 PM | 4.1 | 93.6 km | 10,000 m | 67km NE of Al Baqalitah, Tunisia | usgs.gov |
| 9/26/07 | 9:12 PM | 3.6 | 85.5 km | 10,000 m | Tunisia | usgs.gov |
| 7/13/06 | 1:20 PM | 4.2 | 21.7 km | 10,000 m | Tunisia | usgs.gov |
| 11/16/05 | 9:37 AM | 3.7 | 90.3 km | 10,000 m | Tunisia | usgs.gov |
| 10/29/05 | 6:36 PM | 3.4 | 72.4 km | 12,500 m | Tunisia | usgs.gov |
| 10/29/05 | 6:16 PM | 3.4 | 72.3 km | 12,500 m | Tunisia | usgs.gov |
| 10/27/05 | 7:19 PM | 4 | 93.6 km | 10,000 m | Tunisia | usgs.gov |
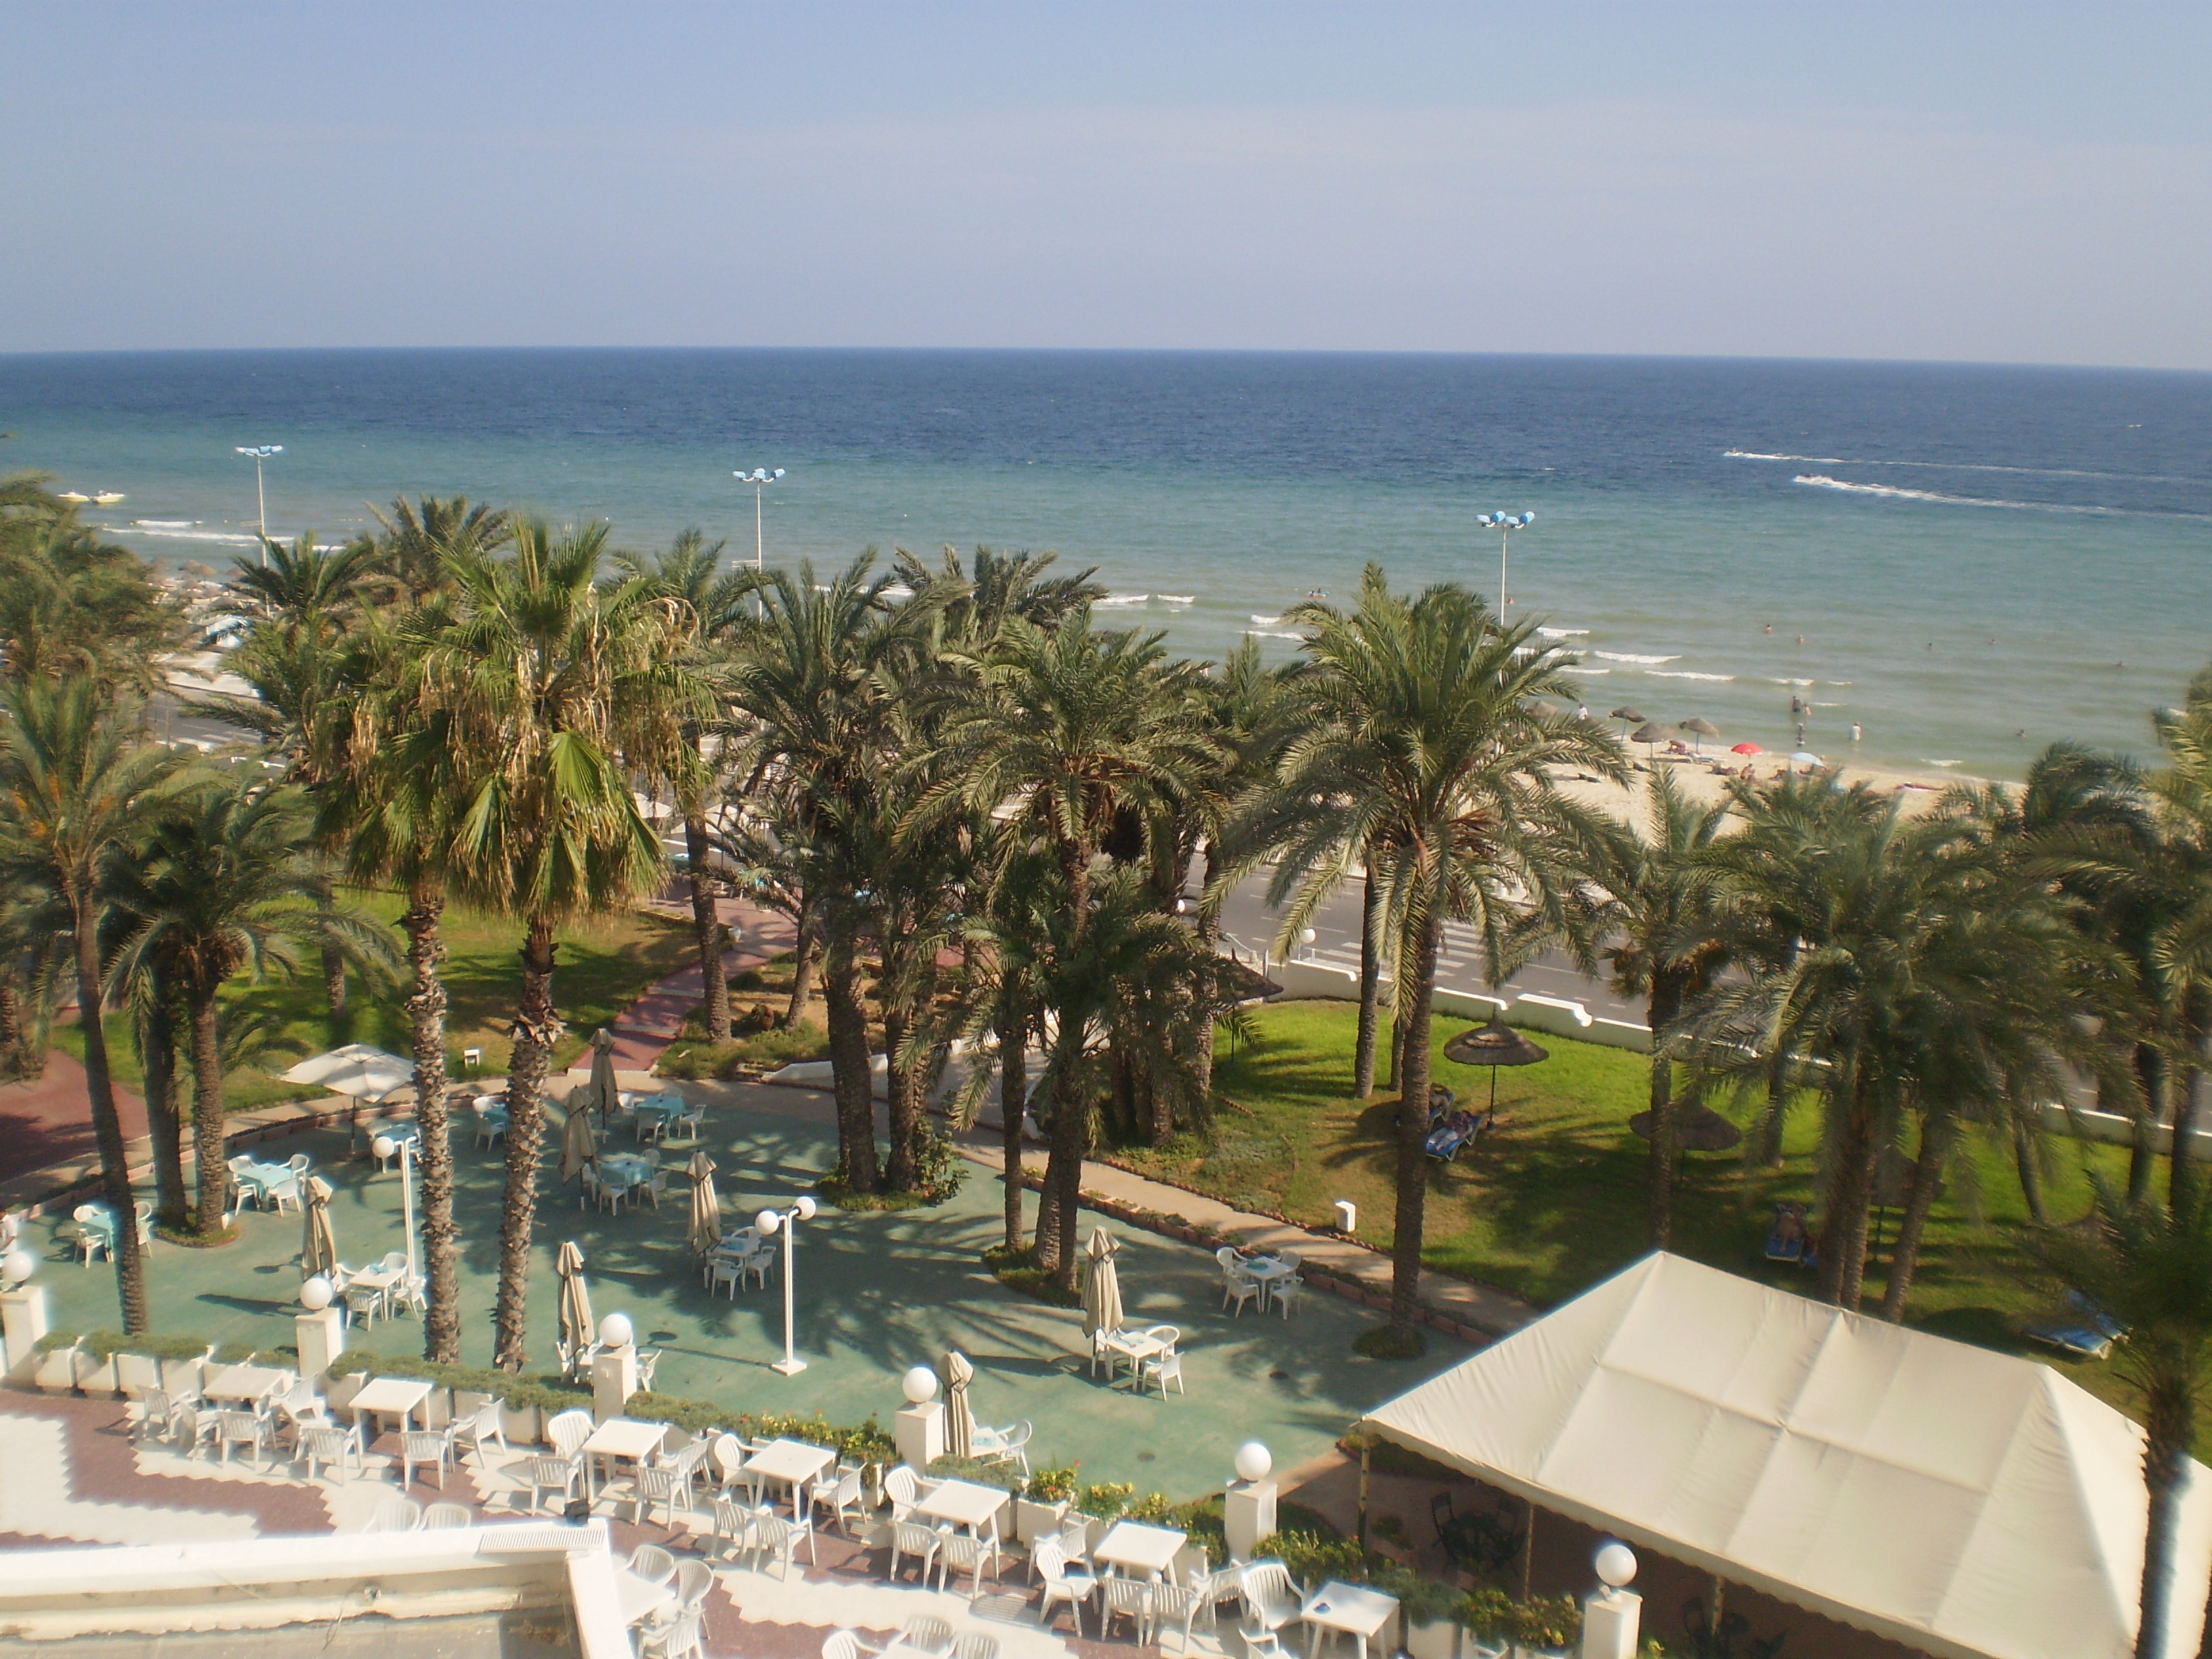
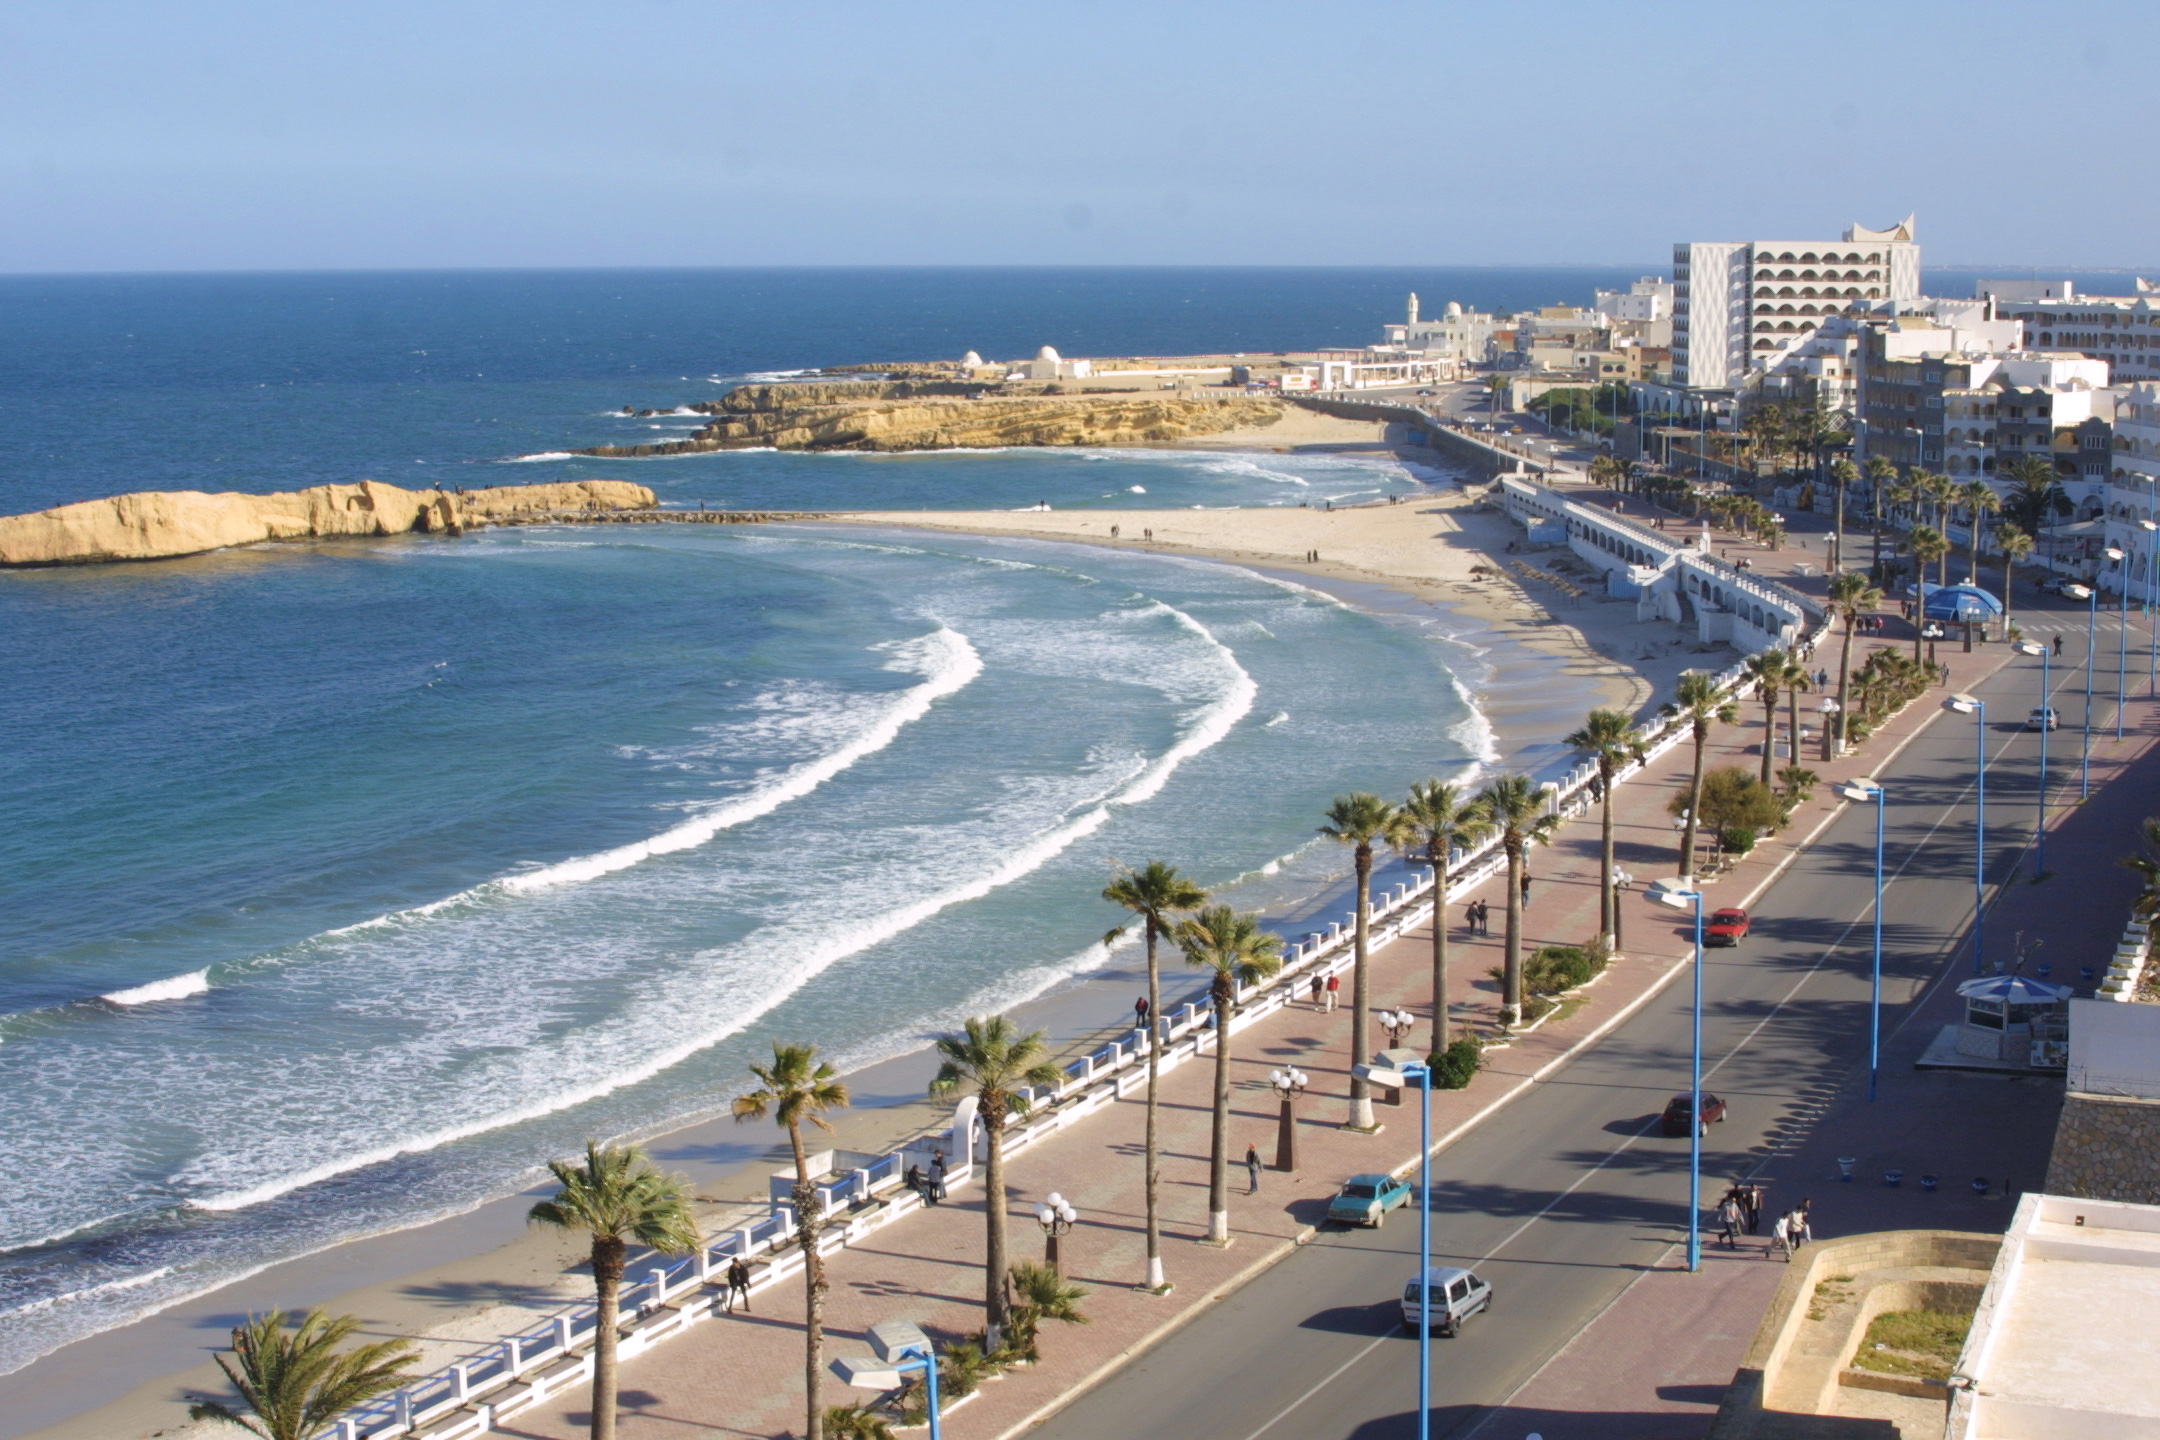
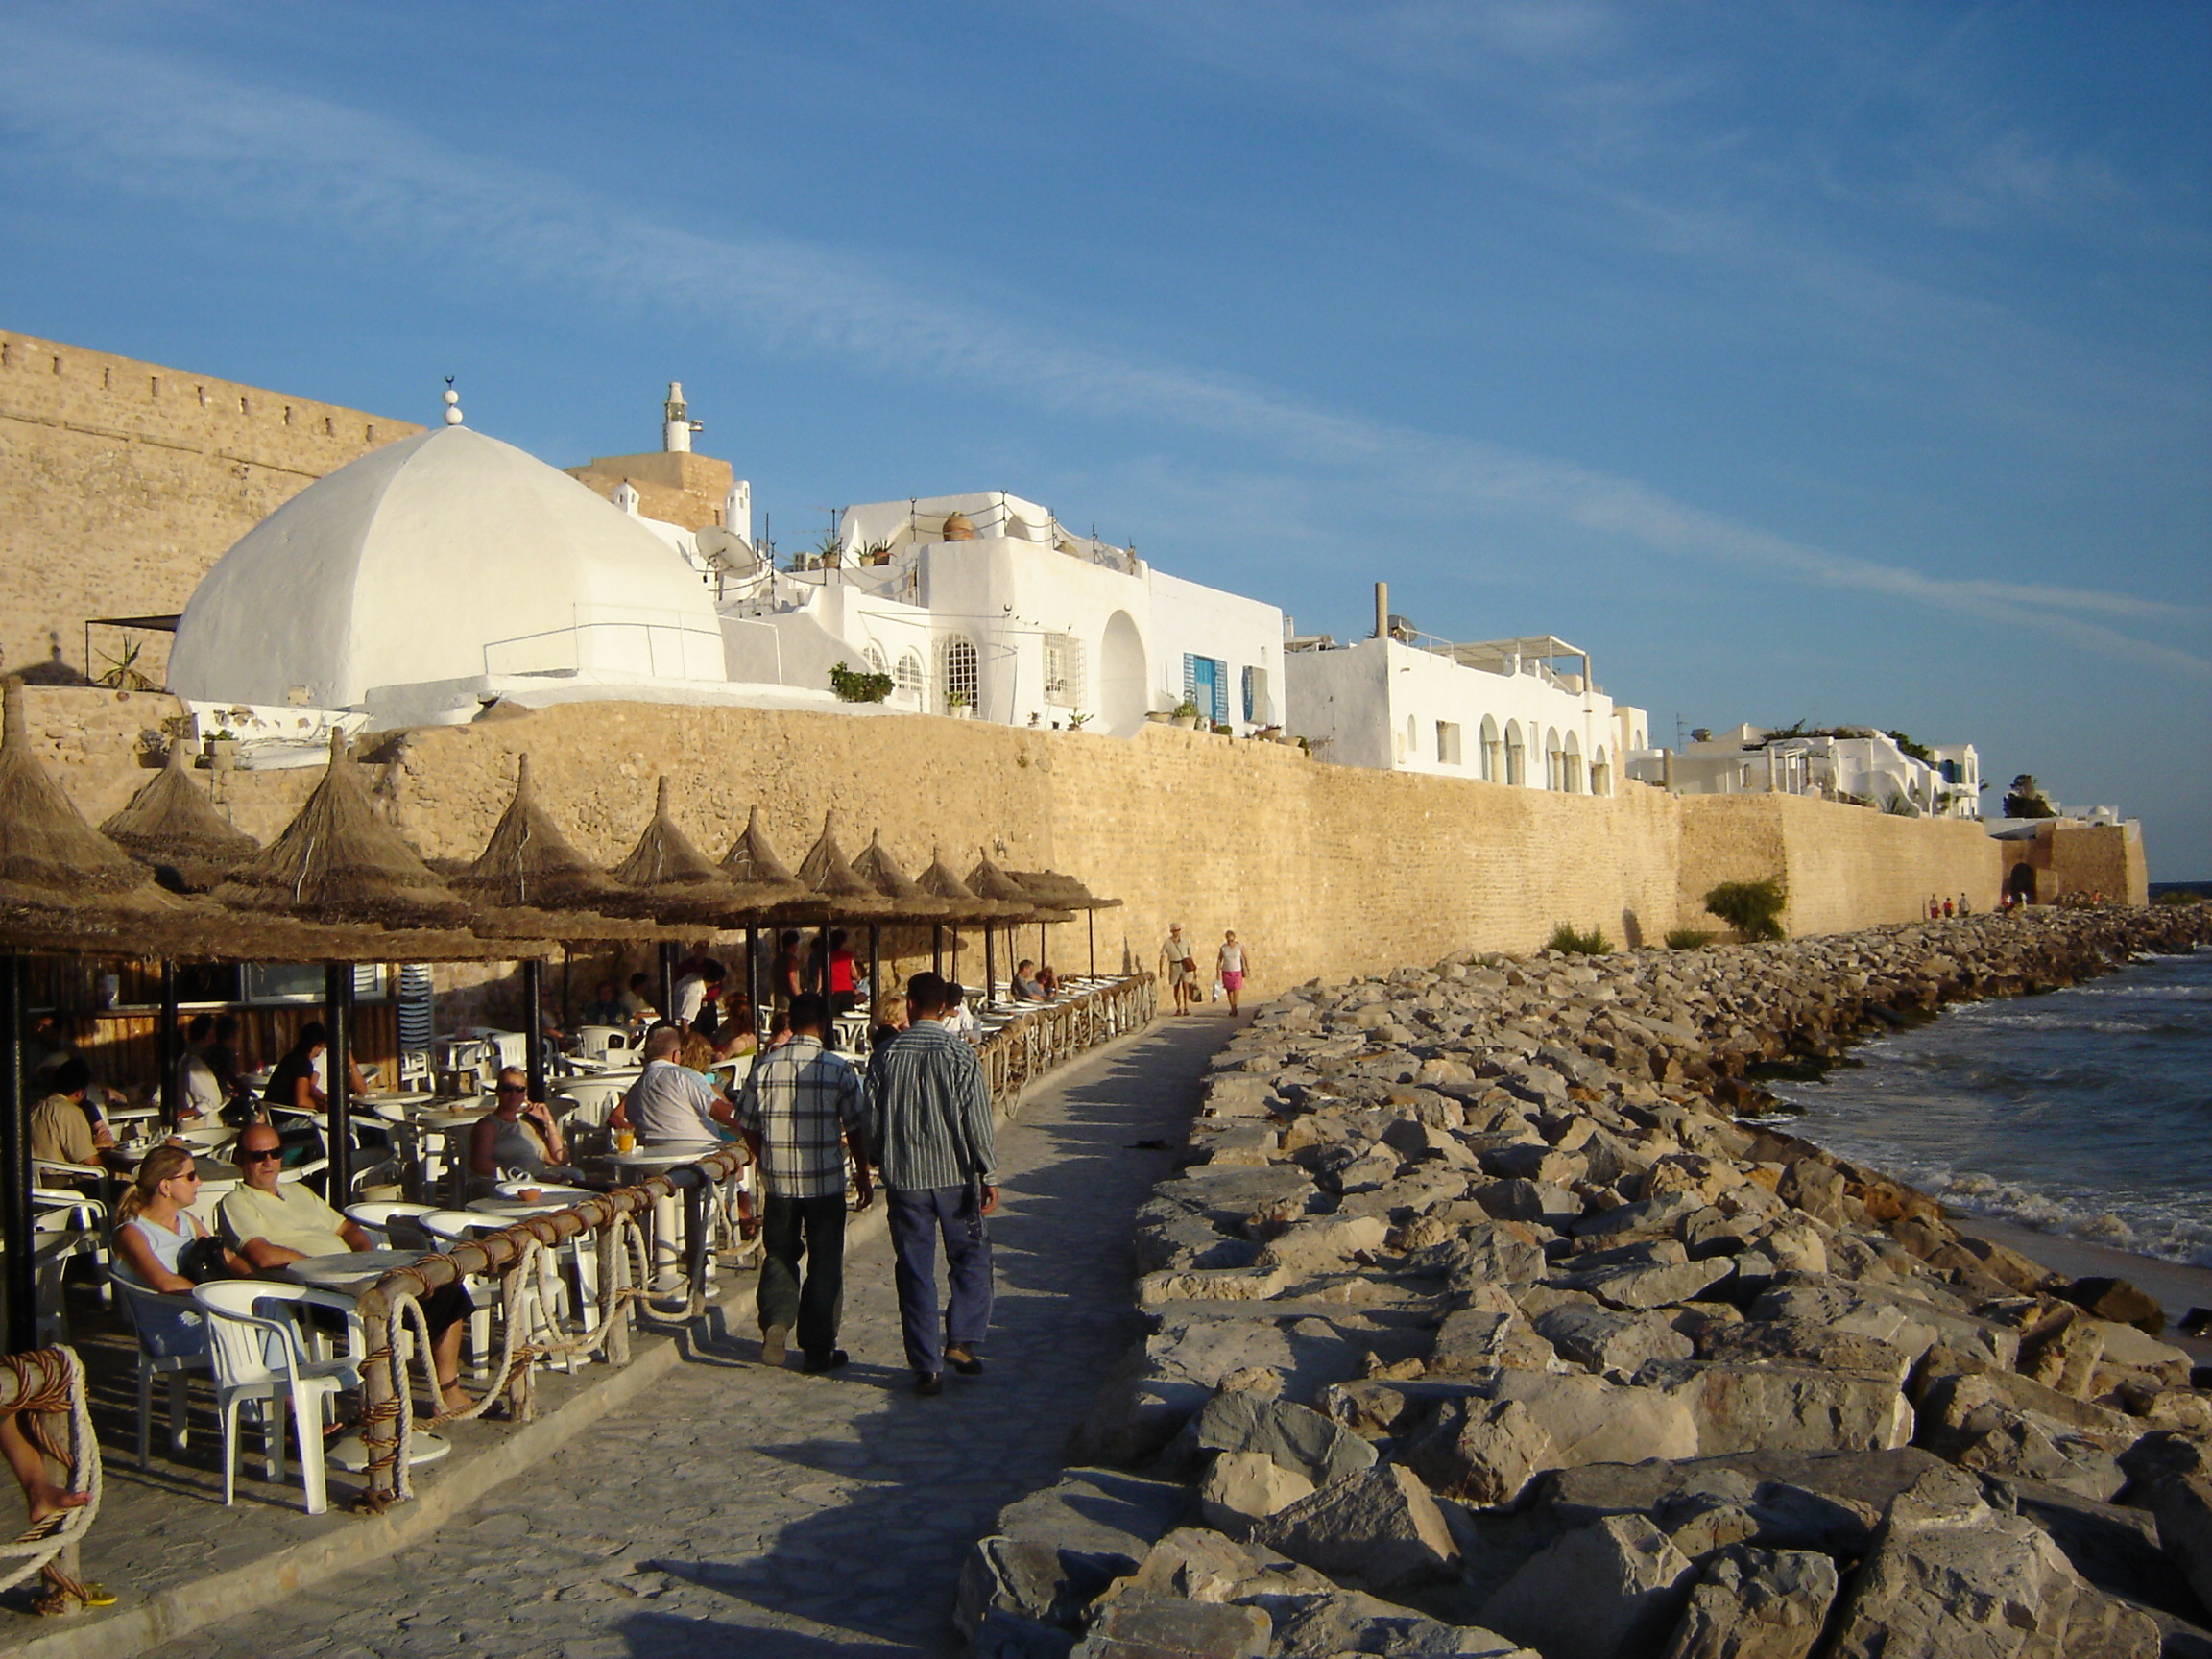
Hergla
Hergla (Tunisian Arabic: هرقلة) is a small cliff-top town in north-eastern Tunisia off the Gulf of Hammamet. White houses of Hergla are built in classic style characteristic for this region.
Hergla Wikipedia Page
About Our Data
The data on this page is estimated using a number of publicly available tools and resources. It is provided without warranty, and could contain inaccuracies. Use at your own risk.